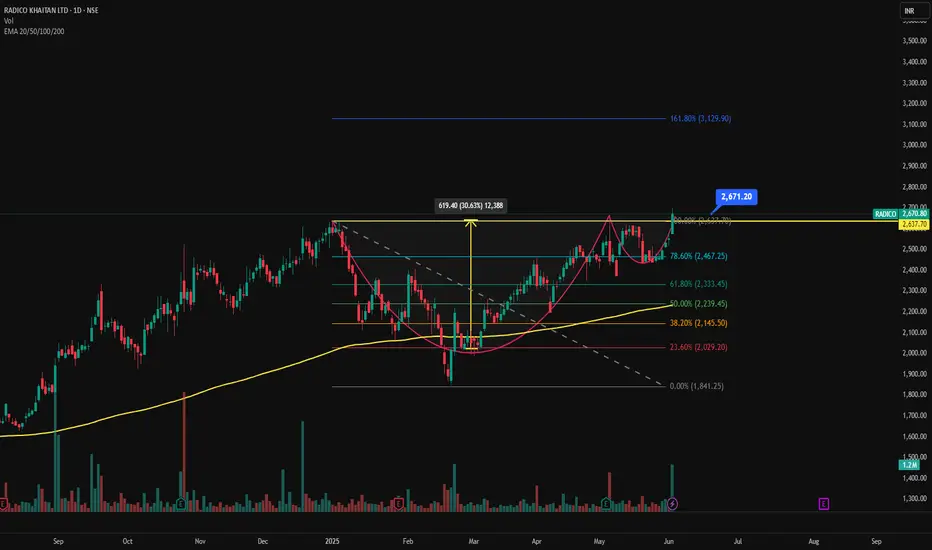
📊 RADICO KHAITAN LTD (RADICO) – Cup & Handle Breakout | Daily Chart
📅 Chart Date: June 4, 2025
📈 CMP: ₹2,670.80 (+4.78%)
📍 Ticker: NSE:RADICO
🔍 Technical Breakdown
☕ Cup & Handle Breakout Confirmed
A classic Cup & Handle formation has played out with a bullish breakout above the neckline near ₹2,640–₹2,670. The pattern is well-structured, showing clear accumulation followed by a rounded bottom and brief consolidation.
📏 Measured Target:
The height of the cup (~₹620) projects an initial target near ₹3,129, aligning closely with the 161.80% Fibonacci Extension level.
⚙️ Indicators Used
🔹 Chart Pattern: Cup & Handle
📐 Fibonacci Retracement & Extension
📊 Volume Spike: Strong breakout volume
📈 EMA Cluster: 20/50/100/200-day — bullish alignment
🟢 EMA Support: Price sustaining well above EMAs; 200 EMA ~₹2,000
📍 Key Price Levels
✅ Breakout Zone: ₹2,640–₹2,670
🚀 Upside Targets:
📈 127.20% – ₹2,853
📈 161.80% – ₹3,129
📈 200% – ₹3,352 (extended swing target)
🛡️ Support Levels:
₹2,467 – 78.6% Fibo
₹2,333 – 61.8%
₹2,145 – 38.2%
₹2,029 – 23.6%
🔻 Invalidation/Stop: Closing below ₹2,467 (strong Fibo + EMA support zone)
💼 Trading Strategy
Entry: On breakout retest or strong close above ₹2,670
Stop Loss: ₹2,467
Target Range: ₹2,853 – ₹3,129 – ₹3,350+
Timeframe: Short to medium term swing
⚠️ Disclaimer
This analysis is for educational purposes only. Please do your own research or consult a financial advisor before making trading/investment decisions.
면책사항
해당 정보와 게시물은 금융, 투자, 트레이딩 또는 기타 유형의 조언이나 권장 사항으로 간주되지 않으며, 트레이딩뷰에서 제공하거나 보증하는 것이 아닙니다. 자세한 내용은 이용 약관을 참조하세요.
면책사항
해당 정보와 게시물은 금융, 투자, 트레이딩 또는 기타 유형의 조언이나 권장 사항으로 간주되지 않으며, 트레이딩뷰에서 제공하거나 보증하는 것이 아닙니다. 자세한 내용은 이용 약관을 참조하세요.