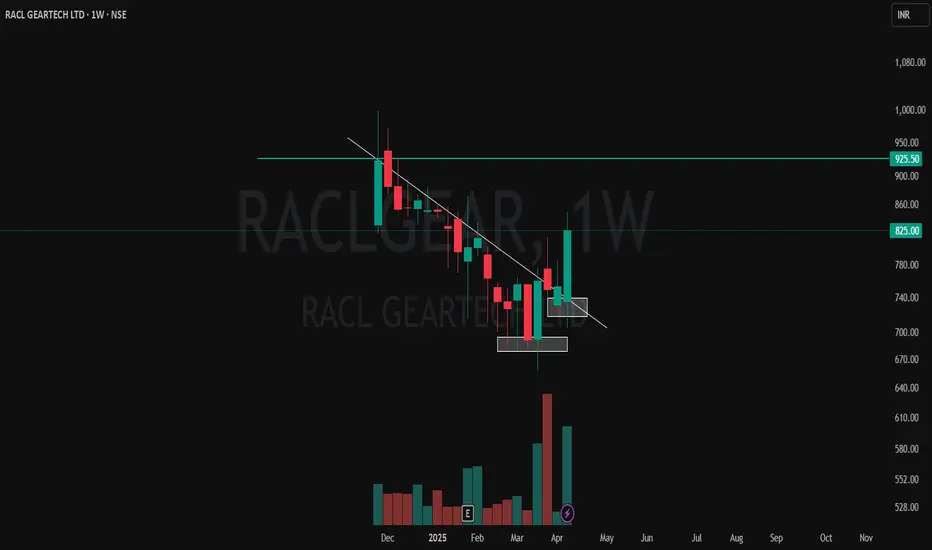
✅ White Line: Represents a well-respected CT trendline — multiple touches before finally getting broken with conviction.
✅ Volume Breakout: Strong volume spike confirms the breakout — classic case of price and volume moving in sync.
✅ White Zones: Marking clear Higher Low formations — price respecting structure before launching up.
✅ Green-Cyan Line: Marks a multi-timeframe supply zone. This level will be critical for continuation or rejection watch.
Structure, volume, and context are lining up — keeping this one on radar for further price action development. 📊
🎯 Master My Self-Made Trading Strategy
📈 Telegram (Learn Today): t.me/hashtaghammer
✅ WhatsApp (Learn Today): wa.me/919455664601
📈 Telegram (Learn Today): t.me/hashtaghammer
✅ WhatsApp (Learn Today): wa.me/919455664601
관련 발행물
면책사항
해당 정보와 게시물은 금융, 투자, 트레이딩 또는 기타 유형의 조언이나 권장 사항으로 간주되지 않으며, 트레이딩뷰에서 제공하거나 보증하는 것이 아닙니다. 자세한 내용은 이용 약관을 참조하세요.