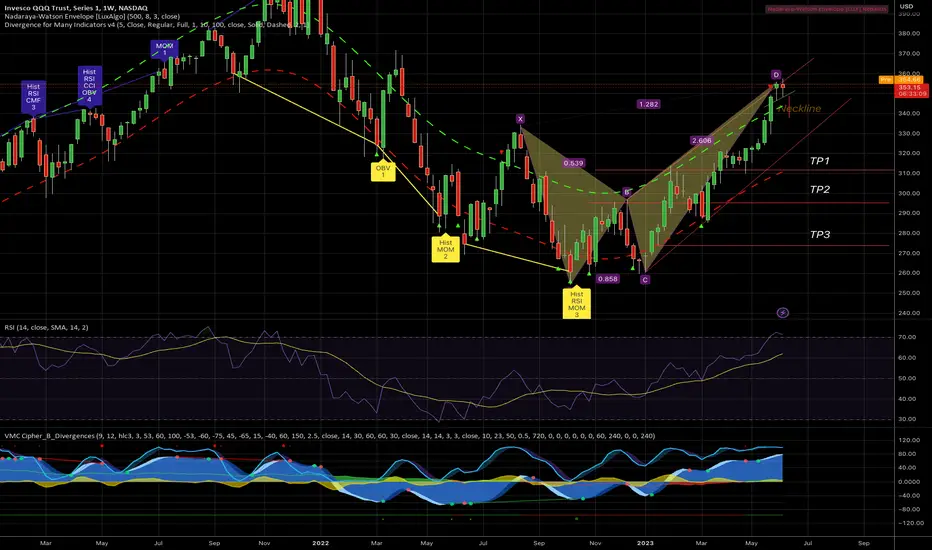
The QQQs have created a head & shoulders pattern now and In the chart, you can see that we have a butterfly-bearish pattern.
For short-term target head and shoulder measurement move the target to 340$
We have a rising wedge pattern when the price breaks the support line of the rising wedge:
1st Target around 310$
2nd Target around 300$
3rd Target around 275$
I guess the price gonna drop to 330 before the FED meeting on the 13th of June.
I'm not a financial advisor.
노트
On 45 min graph, we can see a head and shoulder, a double top pattern, and a 7 bearish confirmation to the downside노트
A double top pattern, and a 7 bearish waiting for the neckline to break 
주문취소됨
면책사항
이 정보와 게시물은 TradingView에서 제공하거나 보증하는 금융, 투자, 거래 또는 기타 유형의 조언이나 권고 사항을 의미하거나 구성하지 않습니다. 자세한 내용은 이용 약관을 참고하세요.
면책사항
이 정보와 게시물은 TradingView에서 제공하거나 보증하는 금융, 투자, 거래 또는 기타 유형의 조언이나 권고 사항을 의미하거나 구성하지 않습니다. 자세한 내용은 이용 약관을 참고하세요.