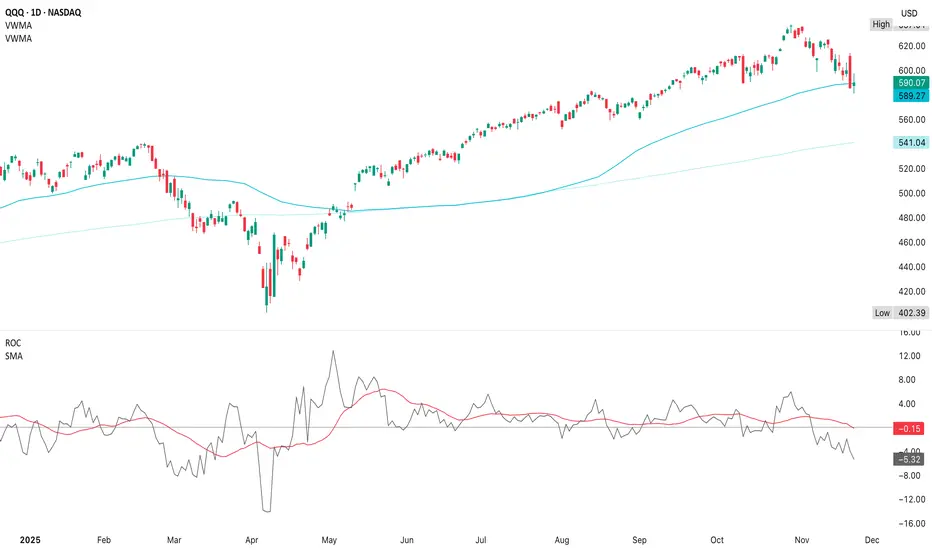
VWMA is like an EMA, but weighted by volume, so it tells you what price the heavy money is actually paying & it exposes trend shifts earlier than simple moving averages
This aligns with the multi-timeframe weakness in stochastics rolling over on daily & 4H & RSI making lower highs

ROC is trending below its signal line which signals that this isn’t just a dip, but that momentum is deteriorating across multiple layers
There are only 2 reasons for VROC to spike this hard (unusual ahead of Thanksgiving) & spikes above 100% only occur near major turning points, both tops & bottoms

This is the opposite of a bottoming structure
Looking at earlier timeframes, initial support is $586-$589
Given VWMA downtrend & ROC weakness, the path of least resistance is still down to the $573-$576 or $560 area unless a catalyst interrupts the selling

Thanksgiving week usually has lighter volume that contribute to false moves & NFP data the following week is a a major event into the December FOMC, so expect a weak bounce ($598-$605) in the next 3-5 trading days with a pullback lower into early/mid December
Until ROC flattens, ROC offers a bullish divergence, price reclaims 20d VWMA & stoch/RSI turn up on the daily, QQQ is still in the middle of a corrective leg down; instead of a real, tradable reversal
- The 20d VWMA is curling down which shows that the short-term trend has firmly turned bearish
- This downturn began well before the breakdown
- The 50d VWMA is flattening, slightly bending down so the medium-term trend is now losing momentum
- When 20d crosses below 50d VWMA (if it happens), that’s a trend-change confirmation
This aligns with the multi-timeframe weakness in stochastics rolling over on daily & 4H & RSI making lower highs
ROC is trending below its signal line which signals that this isn’t just a dip, but that momentum is deteriorating across multiple layers
- ROC is extremely useful for measuring acceleration; rather than, direction
- ROC has been trending under the signal line for about 2 weeks & is now below zero, indicating negative momentum
- No bullish divergence appears yet (price lows not rising vs ROC lows rising)
- The ROC signal line is sloping down which signals sustained weakness
There are only 2 reasons for VROC to spike this hard (unusual ahead of Thanksgiving) & spikes above 100% only occur near major turning points, both tops & bottoms
- Capitulation into a low
- Institutional rotation before another leg lower
This is the opposite of a bottoming structure
- Current ROC behavior matches early-cycle pullback phases from February 2020, September 2021, April 2022 & March 2024
- Each of these periods saw a continued drift lower, lower highs on oscillators & price returning to mid-range support levels
Looking at earlier timeframes, initial support is $586-$589
- $573-$576 is highly probable if the oversold bounce fails
- $558-$563 is weekly support & $540-$545 is less likely, but possible in a deeper correction (50wk MA)
Given VWMA downtrend & ROC weakness, the path of least resistance is still down to the $573-$576 or $560 area unless a catalyst interrupts the selling
- Historically, when ROC breaks below zero & VWMA is rolling over, the pullback usually extends 2-4 weeks
- Price tends to form a lower low or retest the first low before recovering
- Bounce attempts during this period are weak (exactly what we saw this week)
Thanksgiving week usually has lighter volume that contribute to false moves & NFP data the following week is a a major event into the December FOMC, so expect a weak bounce ($598-$605) in the next 3-5 trading days with a pullback lower into early/mid December
- The true reversal likely only after a vol spike & ROC divergence
- This is not yet bottoming behavior, momentum is declining, the short-term bounce attempts are corrective, not impulsive, so the next logical destination remains $573-$576 & then $560
Price may push higher to $605-$612 which means we see a sharper sell-off in December
Until ROC flattens, ROC offers a bullish divergence, price reclaims 20d VWMA & stoch/RSI turn up on the daily, QQQ is still in the middle of a corrective leg down; instead of a real, tradable reversal
I am not a licensed professional & these posts are for informational purposes only, not financial advice
면책사항
해당 정보와 게시물은 금융, 투자, 트레이딩 또는 기타 유형의 조언이나 권장 사항으로 간주되지 않으며, 트레이딩뷰에서 제공하거나 보증하는 것이 아닙니다. 자세한 내용은 이용 약관을 참조하세요.
I am not a licensed professional & these posts are for informational purposes only, not financial advice
면책사항
해당 정보와 게시물은 금융, 투자, 트레이딩 또는 기타 유형의 조언이나 권장 사항으로 간주되지 않으며, 트레이딩뷰에서 제공하거나 보증하는 것이 아닙니다. 자세한 내용은 이용 약관을 참조하세요.