### Market Structure Overview
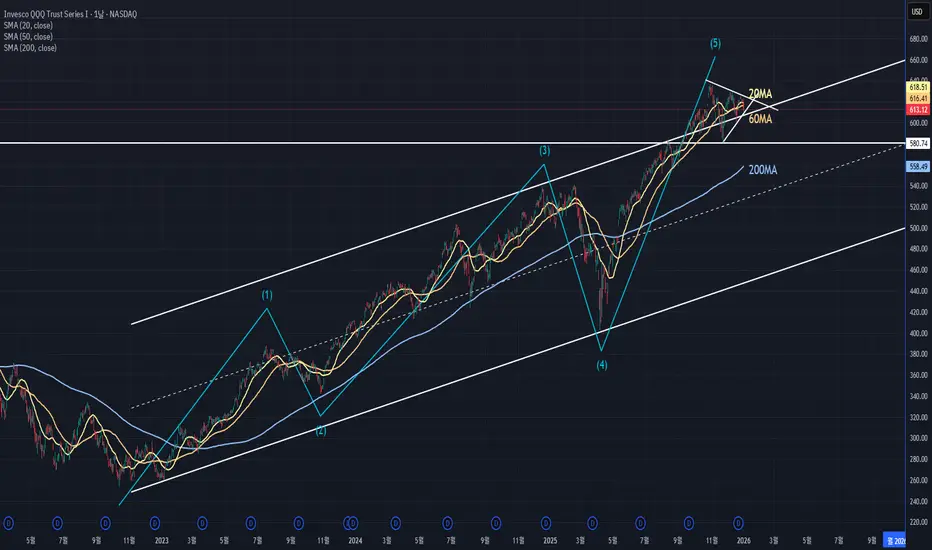
The Nasdaq (QQQ) has been in a strong bullish trend since the 2022 low, forming what appears to be a complete Elliott Wave five-wave structure on the daily timeframe.
After nearly three years of sustained upside momentum, price is now consolidating near the highs rather than extending impulsively.
This behavior often signals a transition phase, where the market shifts from trend expansion to consolidation or correction.
---
### Price Action & Trend Behavior
Following the recent peak, price has moved sideways and formed a tightening structure that resembles a triangular consolidation.
When compression appears after a mature impulse move, it often precedes a broader corrective phase rather than immediate trend continuation.
From a structural perspective, the most important level to monitor is **580.74**.
A daily close below this level would strongly suggest a bearish shift and confirm downside momentum.
---
### Moving Averages Context
The distance between short-term and long-term moving averages expanded significantly during the prior rally.
Such extended separation is typically followed by mean reversion, either through prolonged consolidation or a corrective decline.
Recent price action shows slowing momentum as shorter-term averages flatten and begin converging, reinforcing the idea that upside strength is weakening.
---
### Outlook
If price fails to reclaim the upper trend channel and instead breaks below the consolidation low, the Nasdaq may be entering the **A-wave of a broader ABC corrective structure**.
Until a decisive breakout or breakdown occurs, this zone should be treated as a transition phase rather than a clean trending environment.
For a more detailed breakdown with additional charts and broader market context,
the full analysis is available on my blog:
👉 atelier2580.tistory.com/115 QQQ QQQ
The Nasdaq (QQQ) has been in a strong bullish trend since the 2022 low, forming what appears to be a complete Elliott Wave five-wave structure on the daily timeframe.
After nearly three years of sustained upside momentum, price is now consolidating near the highs rather than extending impulsively.
This behavior often signals a transition phase, where the market shifts from trend expansion to consolidation or correction.
---
### Price Action & Trend Behavior
Following the recent peak, price has moved sideways and formed a tightening structure that resembles a triangular consolidation.
When compression appears after a mature impulse move, it often precedes a broader corrective phase rather than immediate trend continuation.
From a structural perspective, the most important level to monitor is **580.74**.
A daily close below this level would strongly suggest a bearish shift and confirm downside momentum.
---
### Moving Averages Context
The distance between short-term and long-term moving averages expanded significantly during the prior rally.
Such extended separation is typically followed by mean reversion, either through prolonged consolidation or a corrective decline.
Recent price action shows slowing momentum as shorter-term averages flatten and begin converging, reinforcing the idea that upside strength is weakening.
---
### Outlook
If price fails to reclaim the upper trend channel and instead breaks below the consolidation low, the Nasdaq may be entering the **A-wave of a broader ABC corrective structure**.
Until a decisive breakout or breakdown occurs, this zone should be treated as a transition phase rather than a clean trending environment.
For a more detailed breakdown with additional charts and broader market context,
the full analysis is available on my blog:
👉 atelier2580.tistory.com/115
면책사항
해당 정보와 게시물은 금융, 투자, 트레이딩 또는 기타 유형의 조언이나 권장 사항으로 간주되지 않으며, 트레이딩뷰에서 제공하거나 보증하는 것이 아닙니다. 자세한 내용은 이용 약관을 참조하세요.
면책사항
해당 정보와 게시물은 금융, 투자, 트레이딩 또는 기타 유형의 조언이나 권장 사항으로 간주되지 않으며, 트레이딩뷰에서 제공하거나 보증하는 것이 아닙니다. 자세한 내용은 이용 약관을 참조하세요.