📊 QQQ Technical Outlook – Symmetrical Triangle After Pullback
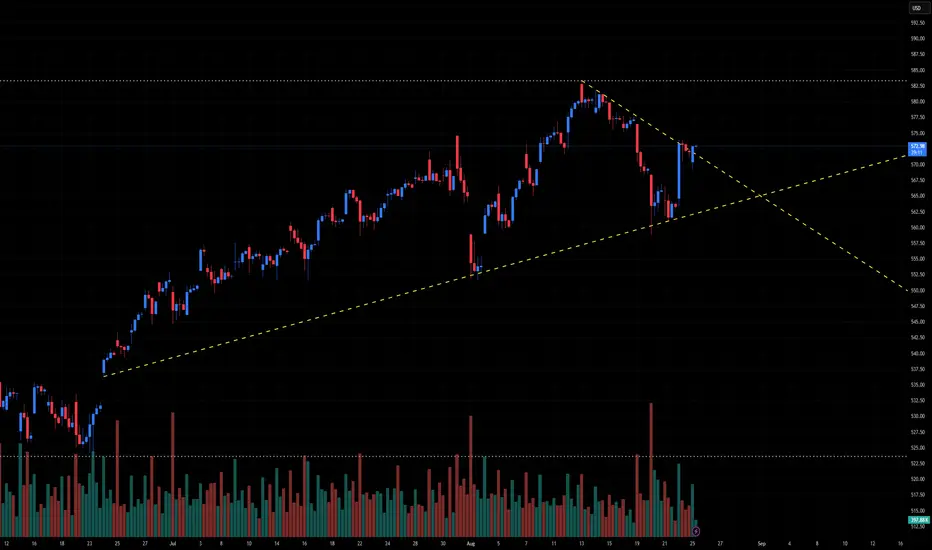
Ticker: QQQ (Invesco Nasdaq-100 ETF)
Timeframe: 30-minute candles
🔍 Current Setup
QQQ has been in a strong uptrend since June, peaking around ~582 before pulling back. Price is now consolidating into a symmetrical triangle, with:
Descending resistance: from ~582 down toward current ~572.
Ascending support: from June lows, now near 563–565.
Current price: ~572, sitting right near the apex.
This structure suggests compression ahead of a breakout move.
📊 Breakout Levels
🚀 Upside (Bullish Scenario)
Trigger: Break and close above 575–577.
Intermediate Targets:
582–585 → Prior highs.
590 → Extension zone.
Measured Move Target: ~600 (triangle height projection).
🔻 Downside (Bearish Scenario)
Trigger: Break below 565, with confirmation under 563.
Intermediate Supports:
555–552 → First demand zone.
540–542 → Stronger support.
Measured Move Target: ~545 (triangle height projection downward).
📈 Volume Analysis
Volume has contracted during this triangle — classic consolidation behavior.
Expect a volume expansion to confirm the breakout direction.
⚖️ Probability Bias
The trend into the pattern was bullish, favoring continuation higher.
Still, failure to defend 565 could quickly open downside risk toward 552–545.
✅ Takeaway
QQQ is at a major decision point inside a symmetrical triangle:
Bullish Break > 577: Targets 582 → 590 → 600
Bearish Break < 565: Targets 555 → 545
액티브 트레이드
HUGE WIN TO $590면책사항
해당 정보와 게시물은 금융, 투자, 트레이딩 또는 기타 유형의 조언이나 권장 사항으로 간주되지 않으며, 트레이딩뷰에서 제공하거나 보증하는 것이 아닙니다. 자세한 내용은 이용 약관을 참조하세요.
면책사항
해당 정보와 게시물은 금융, 투자, 트레이딩 또는 기타 유형의 조언이나 권장 사항으로 간주되지 않으며, 트레이딩뷰에서 제공하거나 보증하는 것이 아닙니다. 자세한 내용은 이용 약관을 참조하세요.