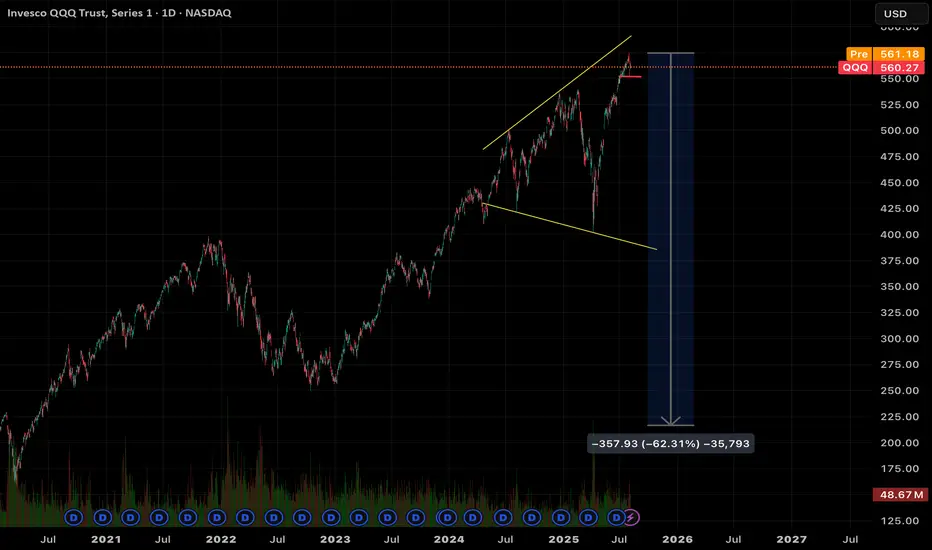
Broadening top seen, with current PO if the recent high is the top. There’s still room to run higher to test the upper boundary of this pattern. Should the current potential head and shoulders top on the hourly chart break out to the downside then the odds of the top being in now increases.
The same head and shoulders pattern is showing up in the major averages and also for Berkshire Hathaway.
The same head and shoulders pattern is showing up in the major averages and also for Berkshire Hathaway.
면책사항
이 정보와 게시물은 TradingView에서 제공하거나 보증하는 금융, 투자, 거래 또는 기타 유형의 조언이나 권고 사항을 의미하거나 구성하지 않습니다. 자세한 내용은 이용 약관을 참고하세요.
면책사항
이 정보와 게시물은 TradingView에서 제공하거나 보증하는 금융, 투자, 거래 또는 기타 유형의 조언이나 권고 사항을 의미하거나 구성하지 않습니다. 자세한 내용은 이용 약관을 참고하세요.