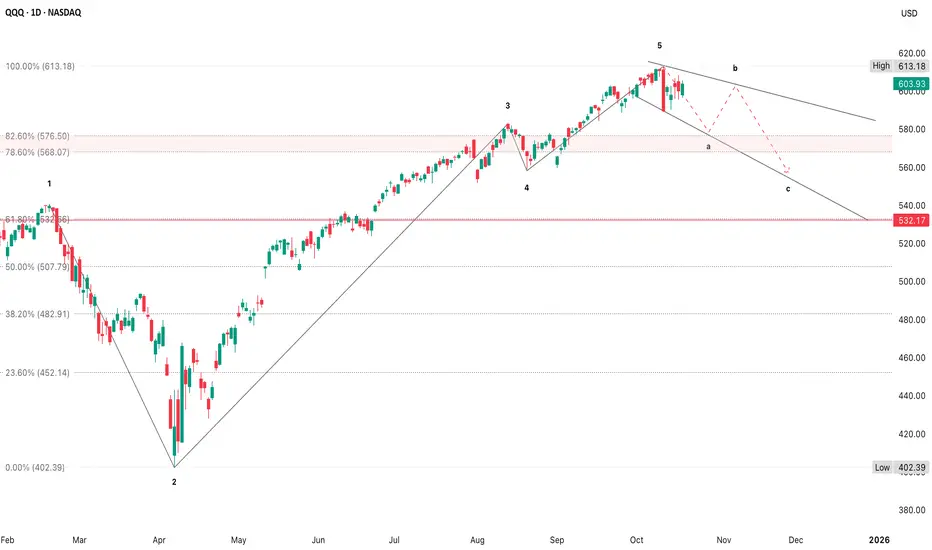
The current leg (mid-2025 onward) is the steepest recovery yet & that slope just broke
The red projection mimics the 2024 & mid-2023 patterns that featured a short distribution, decline & support at the previous breakout area
- This indicates a possible mean reversion phase rather than another leg up
- Steep advance > rounding top > 8-12% correction
- Then a multi-month basing period before recovery
- If that rhythm repeats, the current topping area around $613 could imply a pullback to $560-$580
- That would be a “standard” correction, not a crisis
The red projection mimics the 2024 & mid-2023 patterns that featured a short distribution, decline & support at the previous breakout area
- The support shelf sits near $580-$585, where prior resistance turned support (June-July 2025)
- Below $575 would confirm a more durable trend break & that’s where longer-term funds start de-risking
- Large-scale corrections on this timeframe (daily, spanning 6-12 months) usually take 2-4 weeks to play out from first break to low, followed by a 1-3 week consolidation near the floor
- So if the current roll continues, your next decisive move window is late October into early November
- If you’re trading via options, it reinforces using 2-3 week puts since they align with both the short-term structure & this macro corrective window
I am not a licensed professional & these posts are for informational purposes only, not financial advice
면책사항
이 정보와 게시물은 TradingView에서 제공하거나 보증하는 금융, 투자, 거래 또는 기타 유형의 조언이나 권고 사항을 의미하거나 구성하지 않습니다. 자세한 내용은 이용 약관을 참고하세요.
I am not a licensed professional & these posts are for informational purposes only, not financial advice
면책사항
이 정보와 게시물은 TradingView에서 제공하거나 보증하는 금융, 투자, 거래 또는 기타 유형의 조언이나 권고 사항을 의미하거나 구성하지 않습니다. 자세한 내용은 이용 약관을 참고하세요.