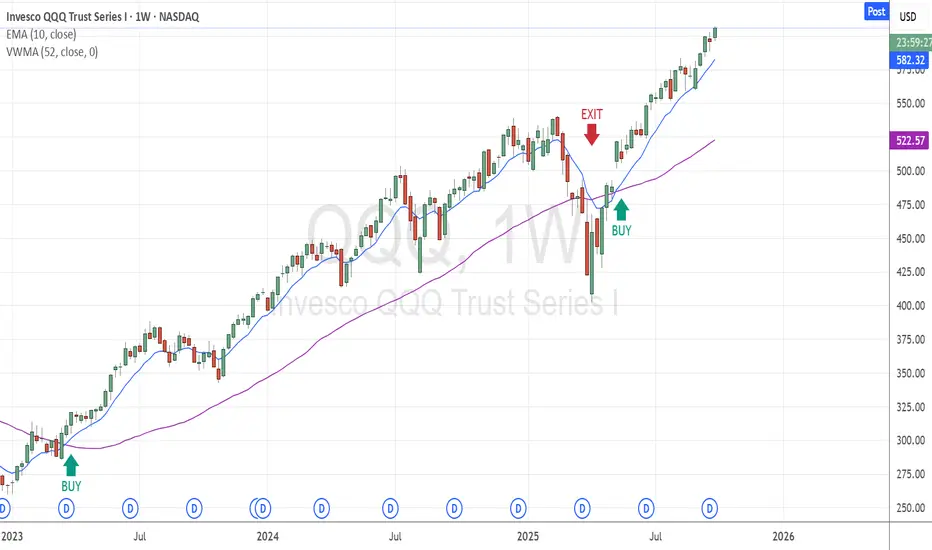
This strategy is designed for long-term investors using a simple, two-indicator setup on the weekly chart:
• VWMA (Volume-Weighted Moving Average) – 52-period
• EMA (Exponential Moving Average) – 10-period
✅ Entry Signal (Buy)
• Enter a position when the 10-period EMA crosses above the 52-period VWMA.
This crossover suggests a potential upward trend supported by volume.
❌ Exit Signal (close Long Position)
• Exit the position when the 10-period EMA crosses below the 52-period VWMA.
This indicates a possible trend reversal or weakening momentum.
💡 Additional Note
• When the 10 EMA is below the 52 VWMA, it's best to stay in cash and wait patiently for the next bullish crossover. This helps avoid false entries and keeps you aligned with the broader trend.
면책사항
이 정보와 게시물은 TradingView에서 제공하거나 보증하는 금융, 투자, 거래 또는 기타 유형의 조언이나 권고 사항을 의미하거나 구성하지 않습니다. 자세한 내용은 이용 약관을 참고하세요.
면책사항
이 정보와 게시물은 TradingView에서 제공하거나 보증하는 금융, 투자, 거래 또는 기타 유형의 조언이나 권고 사항을 의미하거나 구성하지 않습니다. 자세한 내용은 이용 약관을 참고하세요.