Very simple chart...
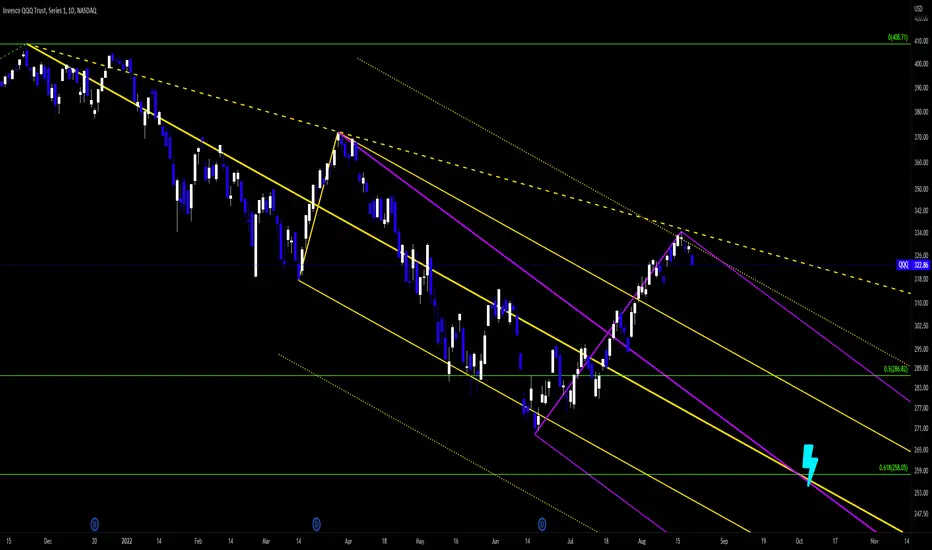
QQQ broke up out of the original fork (Yellow).
Price appears to be stalling out at the trigger line (Yellow-Dashed).
In addition, I plotted a warning line, using the 2.0 extension of the fork's median-line parallels to show another potential resistance area. (Yellow-Dotted)
Assuming that the Q's fail to sustain the rally past the trigger line/2.0 warning line; I've added another fork (purple) using the "C" pivot of the yellow fork as my origin point/"A" pivot, and the June low / August high as my "B" & "C" pivot.
I've noticed that the median lines of both forks cross to form what's known as an "Energy Point" right at the 0.618 fib level, aka $258 price level. (Measured from Covid Low to "Everything Bubble" high)
Energy Points pull price towards them like a magnet.
This Energy Point appears to take place between September 27th - October 4th.
I'm expecting the QQQ to fall at/near this energy point by early October.
Fat_Fat
노트
Full View of the Fib Retracement
노트
I don't know why the .618 is not visible in the snapshot... If you click the image you'll see it.노트
Took profits on most of my puts today. Roughly 75% of the trade.노트
Closed Trade in full today $$$$$면책사항
이 정보와 게시물은 TradingView에서 제공하거나 보증하는 금융, 투자, 거래 또는 기타 유형의 조언이나 권고 사항을 의미하거나 구성하지 않습니다. 자세한 내용은 이용 약관을 참고하세요.
면책사항
이 정보와 게시물은 TradingView에서 제공하거나 보증하는 금융, 투자, 거래 또는 기타 유형의 조언이나 권고 사항을 의미하거나 구성하지 않습니다. 자세한 내용은 이용 약관을 참고하세요.