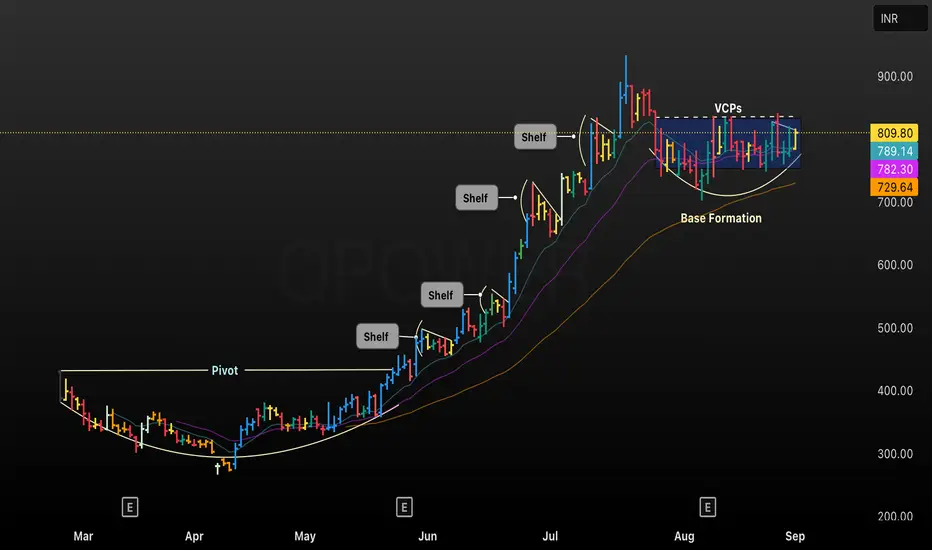
This TradingView chart of QPOWER showcases a classic growth stock progression from a Pivot breakout through multiple consolidation phases known as Shelves, indicated by horizontal pauses in price action above key moving averages. The recent price structure features a well-defined Base Formation followed by multiple VCPs (Volatility Contraction Patterns), signaling tightening price ranges and potential breakout readiness. Key moving averages are highlighted (789.14, 782.30, 729.64) to guide risk management for trend-following entries and exits.
• Technical patterns annotated: Pivot, Shelf, VCP, Base Formation
• Chart timeframe: Daily (D)
• Purpose: Used for trade decision-making and educational discussion on breakout setups and volatility contraction patterns
• Technical patterns annotated: Pivot, Shelf, VCP, Base Formation
• Chart timeframe: Daily (D)
• Purpose: Used for trade decision-making and educational discussion on breakout setups and volatility contraction patterns
면책사항
해당 정보와 게시물은 금융, 투자, 트레이딩 또는 기타 유형의 조언이나 권장 사항으로 간주되지 않으며, 트레이딩뷰에서 제공하거나 보증하는 것이 아닙니다. 자세한 내용은 이용 약관을 참조하세요.
면책사항
해당 정보와 게시물은 금융, 투자, 트레이딩 또는 기타 유형의 조언이나 권장 사항으로 간주되지 않으며, 트레이딩뷰에서 제공하거나 보증하는 것이 아닙니다. 자세한 내용은 이용 약관을 참조하세요.