Pyramid Technoplast Ltd – Falling Trendline Breakout! 💥
📅 Date: April 8, 2025
📊 Chart Analysis:
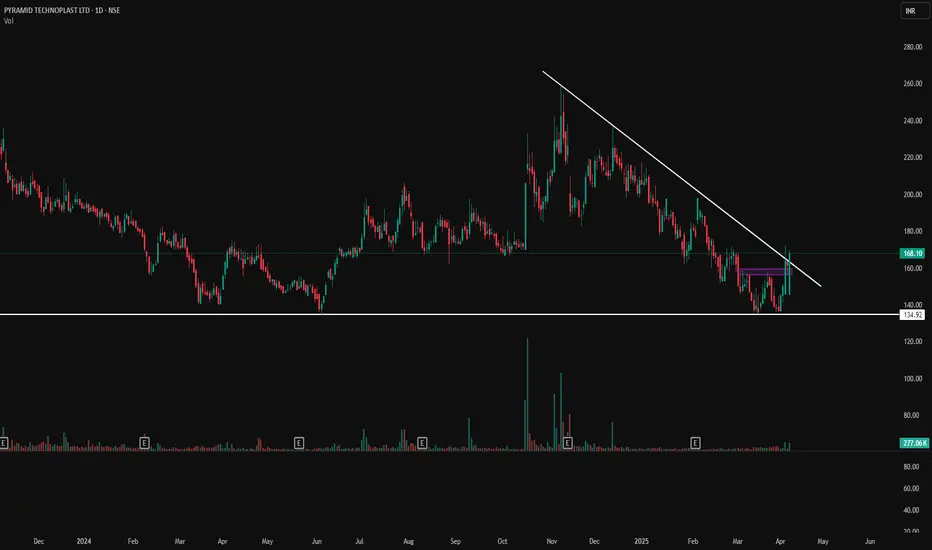
The stock has successfully broken out of a long-term falling trendline, indicating a potential reversal of the previous downtrend. This move is backed by strong bullish candles and an increase in volume.
📌 Key Levels:
📉 Major Support: ₹134.92
🔄 Previous Resistance/Flip Zone: ₹160-165 (now acting as support)
📈 Immediate Resistance Levels: ₹180, ₹195, ₹210
📈 Technical Indicators & Patterns:
Falling Trendline Breakout visible with strong bullish momentum.
Volume confirmation indicates institutional interest.
Price closing above ₹165 can lead to further upside.
🔍 Volume Insight:
Volume surged to 277K, which is significantly higher than the average, adding credibility to the breakout.
🚀 Potential Setup:
If price holds above ₹165–₹168, next targets could be ₹180 and ₹195.
Pullback toward ₹160–₹165 zone can be seen as a retest and buying opportunity.
📌 Disclaimer: This is for educational and analysis purposes only. Always consult your financial advisor before making investment decisions.
📅 Date: April 8, 2025
📊 Chart Analysis:
The stock has successfully broken out of a long-term falling trendline, indicating a potential reversal of the previous downtrend. This move is backed by strong bullish candles and an increase in volume.
📌 Key Levels:
📉 Major Support: ₹134.92
🔄 Previous Resistance/Flip Zone: ₹160-165 (now acting as support)
📈 Immediate Resistance Levels: ₹180, ₹195, ₹210
📈 Technical Indicators & Patterns:
Falling Trendline Breakout visible with strong bullish momentum.
Volume confirmation indicates institutional interest.
Price closing above ₹165 can lead to further upside.
🔍 Volume Insight:
Volume surged to 277K, which is significantly higher than the average, adding credibility to the breakout.
🚀 Potential Setup:
If price holds above ₹165–₹168, next targets could be ₹180 and ₹195.
Pullback toward ₹160–₹165 zone can be seen as a retest and buying opportunity.
📌 Disclaimer: This is for educational and analysis purposes only. Always consult your financial advisor before making investment decisions.
면책사항
이 정보와 게시물은 TradingView에서 제공하거나 보증하는 금융, 투자, 거래 또는 기타 유형의 조언이나 권고 사항을 의미하거나 구성하지 않습니다. 자세한 내용은 이용 약관을 참고하세요.
면책사항
이 정보와 게시물은 TradingView에서 제공하거나 보증하는 금융, 투자, 거래 또는 기타 유형의 조언이나 권고 사항을 의미하거나 구성하지 않습니다. 자세한 내용은 이용 약관을 참고하세요.