hi traders
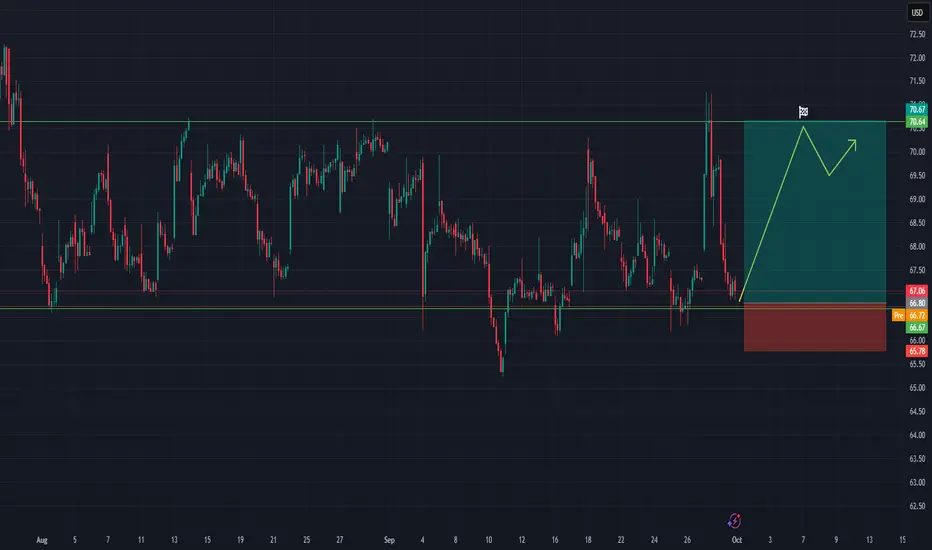
PayPal is currently trading around $66.80 – $67.00 after retesting a key support level that has held multiple times in recent sessions. The price action shows consolidation near support, with potential for a bullish reversal.
Entry Zone:
Around $66.80 – $67.00 (current support area).
Stop Loss (SL):
Below $65.78 (recent swing low and invalidation zone).
Take Profit (TP):
Targeting $70.60 – $70.70 (strong resistance and recent highs).
Risk/Reward Ratio (RRR):
Approximately 1:3, favorable setup for a long position.
Trade Thesis:
The chart suggests a bounce from support with momentum building for an upside move.
If the price holds above the $66.80 support zone, there is room for a bullish push toward the $70.60 resistance.
Confirmation can come from bullish candles forming around the current level.
Plan:
Go long near $67.00.
Place stop below $65.78.
Aim for $70.60+ as the first profit target.
Partial profits may be secured on the way up, with stop moved to breakeven for risk management.
거래청산: 타겟 닿음
target reached.💥 Free signals and ideas ➡ t.me/vfinvestment
면책사항
해당 정보와 게시물은 금융, 투자, 트레이딩 또는 기타 유형의 조언이나 권장 사항으로 간주되지 않으며, 트레이딩뷰에서 제공하거나 보증하는 것이 아닙니다. 자세한 내용은 이용 약관을 참조하세요.
💥 Free signals and ideas ➡ t.me/vfinvestment
면책사항
해당 정보와 게시물은 금융, 투자, 트레이딩 또는 기타 유형의 조언이나 권장 사항으로 간주되지 않으며, 트레이딩뷰에서 제공하거나 보증하는 것이 아닙니다. 자세한 내용은 이용 약관을 참조하세요.