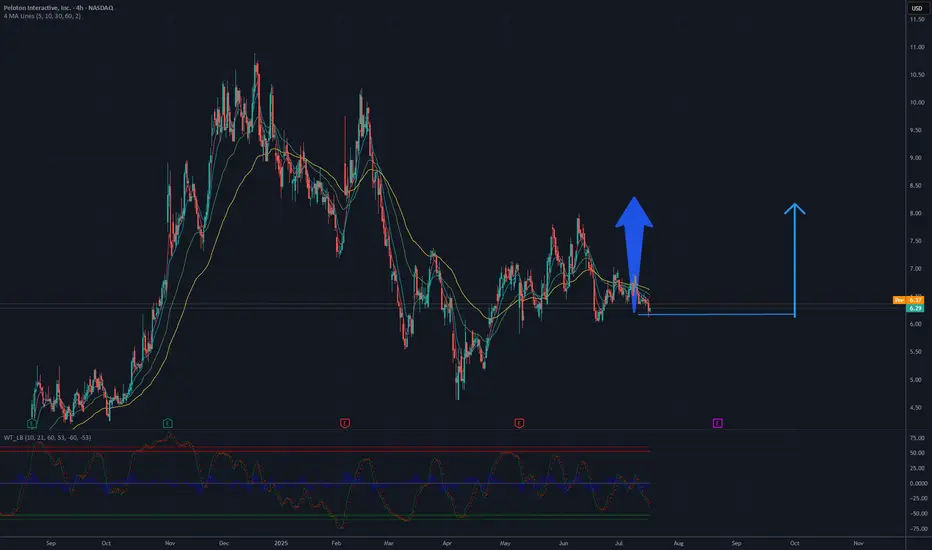
The chart analysis for Peloton Interactive, Inc. (PTON) suggests a potential rise with a target of 8.20 USD. The 4-hour chart indicates a recent downtrend from a peak around 10 USD, with the current price stabilizing near 6.30 USD. A key support level is observed around 6 USD, which could provide a strong base for an upward move. The 50-day and 200-day moving averages are converging, hinting at a possible trend reversal if buying pressure increases.
Breaking through the resistance at 6.50-6.70 USD, a recent consolidation zone, could trigger a rally. With rising volume and bullish candlestick formations, the price may aim for 8.20 USD, a significant resistance level based on prior highs. The RSI, currently in oversold territory, could support this upward movement if it starts to recover, indicating renewed momentum. However, a drop below 6 USD support could invalidate this outlook and lead to further declines.
Potential TP: 8.20 USD
거래청산: 타겟 닿음
Target Done!면책사항
해당 정보와 게시물은 금융, 투자, 트레이딩 또는 기타 유형의 조언이나 권장 사항으로 간주되지 않으며, 트레이딩뷰에서 제공하거나 보증하는 것이 아닙니다. 자세한 내용은 이용 약관을 참조하세요.
면책사항
해당 정보와 게시물은 금융, 투자, 트레이딩 또는 기타 유형의 조언이나 권장 사항으로 간주되지 않으며, 트레이딩뷰에서 제공하거나 보증하는 것이 아닙니다. 자세한 내용은 이용 약관을 참조하세요.