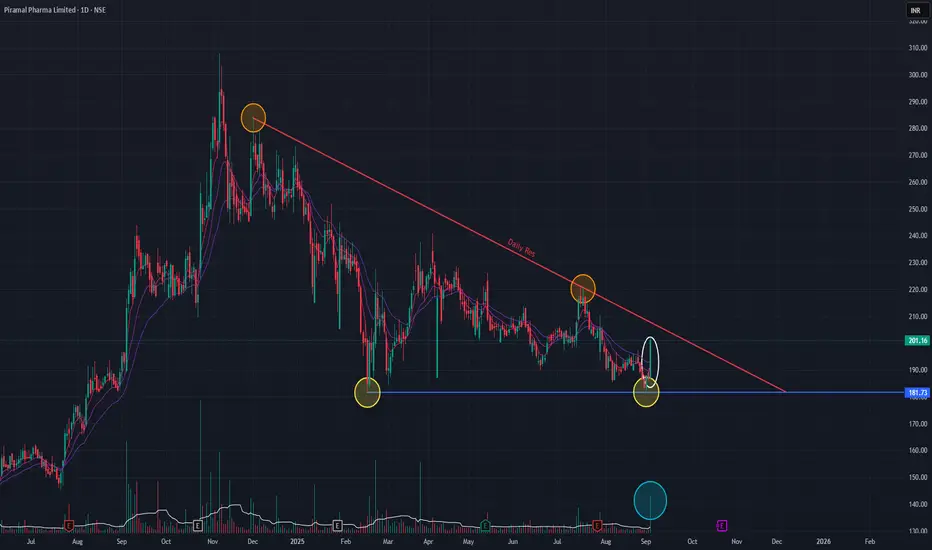
Piramal Pharma, has formed a Double-Bottom chart pattern, indicating Bullish reversal. With today's bullish candle the volume has also spiked. We should watch out for the price action in the coming days. As indicated in the chart, resistance trendline is respected as well as the support trendline. If the stock has to move up, then it has to breach the resistance trendline.
Let's keep a watch on it.
Let's keep a watch on it.
Disclaimer: This analysis is my personal view & for educational purposes only. They shall not be construed as trade or investment advice. Before making any financial decision, it is imperative that you consult with a qualified financial professional.
면책사항
해당 정보와 게시물은 금융, 투자, 트레이딩 또는 기타 유형의 조언이나 권장 사항으로 간주되지 않으며, 트레이딩뷰에서 제공하거나 보증하는 것이 아닙니다. 자세한 내용은 이용 약관을 참조하세요.