- The relative strength index (RSI) is a momentum indicator used in technical analysis. RSI measures the speed and magnitude of a security's recent price changes to detect overbought or oversold conditions in the price of that security. The RSI is displayed as an oscillator (a line graph) on a scale of 0 to 100
- Moving average convergence/divergence (MACD) is a technical indicator that helps investors identify price trends, measure trend momentum, and identify entry points for buying or selling a security. Gerald Appel developed the MACD indicator in the 1970s, and it is still one of the most popular technical tools today.
- Moving average convergence/divergence (MACD) is a technical indicator that helps investors identify price trends, measure trend momentum, and identify entry points for buying or selling a security. Gerald Appel developed the MACD indicator in the 1970s, and it is still one of the most popular technical tools today.
액티브 트레이드
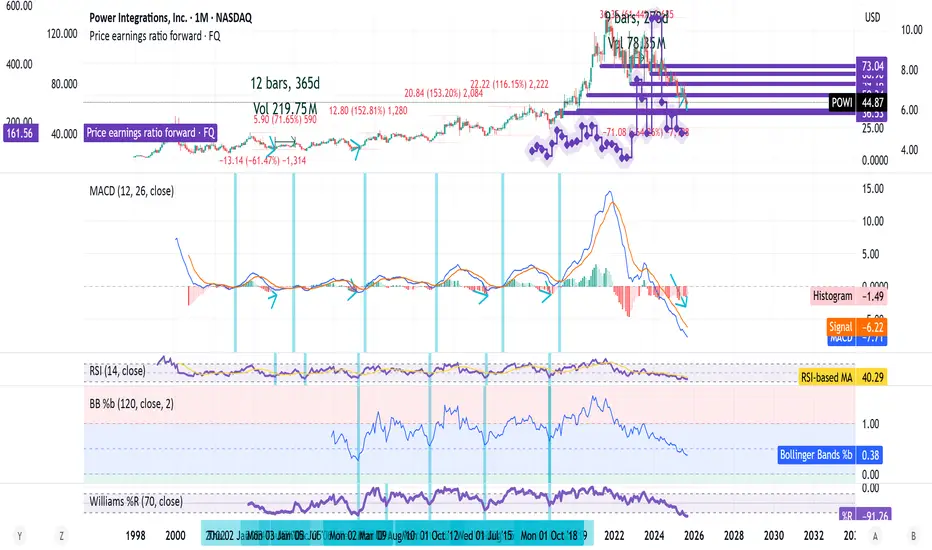
P/E Is really high comparing it with previous troughs !P/E Forward is in a very good place, probable trough in progress !
거래청산: 타겟 닿음
Volume has no "Spike" in it to suggest a major trough has been struck, yet the averages is pretty high which may imply a trough is in already or about to be struck !
노트
+60% in the next 10-12 Months if we rhythm with the past with everything in the universe absolute
노트
Relative to SPX, we are pretty much like 2006's low, all else in the "Universe" absolute !I do more in depth studies of stocks on my twitter account. Hope you would enjoy it there as you are enjoying it here.
****** Past performance is no guarantee of future results***
twitter.com/samitrading1
****** Past performance is no guarantee of future results***
twitter.com/samitrading1
면책사항
이 정보와 게시물은 TradingView에서 제공하거나 보증하는 금융, 투자, 거래 또는 기타 유형의 조언이나 권고 사항을 의미하거나 구성하지 않습니다. 자세한 내용은 이용 약관을 참고하세요.
I do more in depth studies of stocks on my twitter account. Hope you would enjoy it there as you are enjoying it here.
****** Past performance is no guarantee of future results***
twitter.com/samitrading1
****** Past performance is no guarantee of future results***
twitter.com/samitrading1
면책사항
이 정보와 게시물은 TradingView에서 제공하거나 보증하는 금융, 투자, 거래 또는 기타 유형의 조언이나 권고 사항을 의미하거나 구성하지 않습니다. 자세한 내용은 이용 약관을 참고하세요.