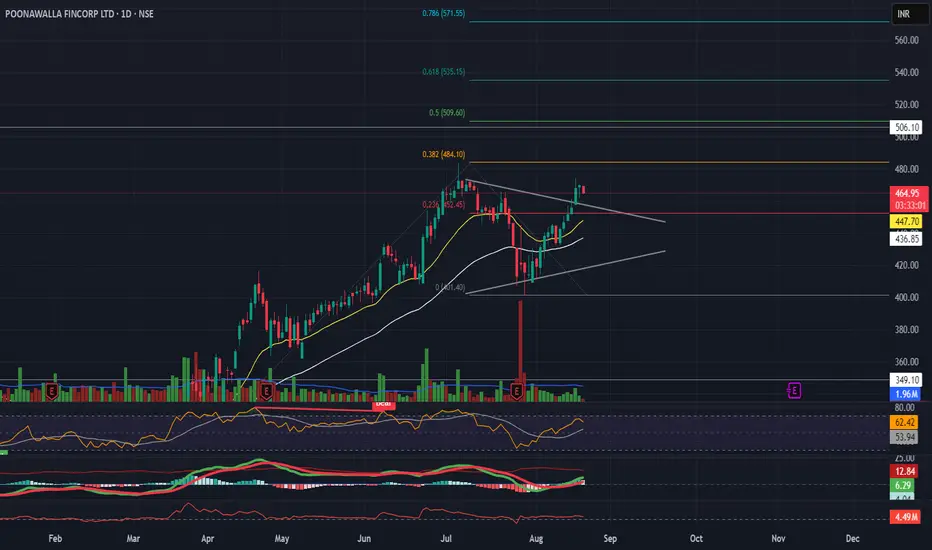
Setup: Clear breakout above trendline resistance on daily chart.
Indicators:
RSI at 62 → momentum strong, near overbought but not overheated.
MACD bullish crossover with positive histogram.
EMAs: 20 & 50 EMA slope positive; price sustaining above both.
Levels:
Stoploss: ₹445
Targets: ₹509 immediate, then ₹535
👉 Outlook: Strong bullish bias. Sustaining above ₹473 opens path towards ₹500–506 zone. Support at ₹445.
면책사항
해당 정보와 게시물은 금융, 투자, 트레이딩 또는 기타 유형의 조언이나 권장 사항으로 간주되지 않으며, 트레이딩뷰에서 제공하거나 보증하는 것이 아닙니다. 자세한 내용은 이용 약관을 참조하세요.
면책사항
해당 정보와 게시물은 금융, 투자, 트레이딩 또는 기타 유형의 조언이나 권장 사항으로 간주되지 않으며, 트레이딩뷰에서 제공하거나 보증하는 것이 아닙니다. 자세한 내용은 이용 약관을 참조하세요.