📈 Weekly Technical Outlook
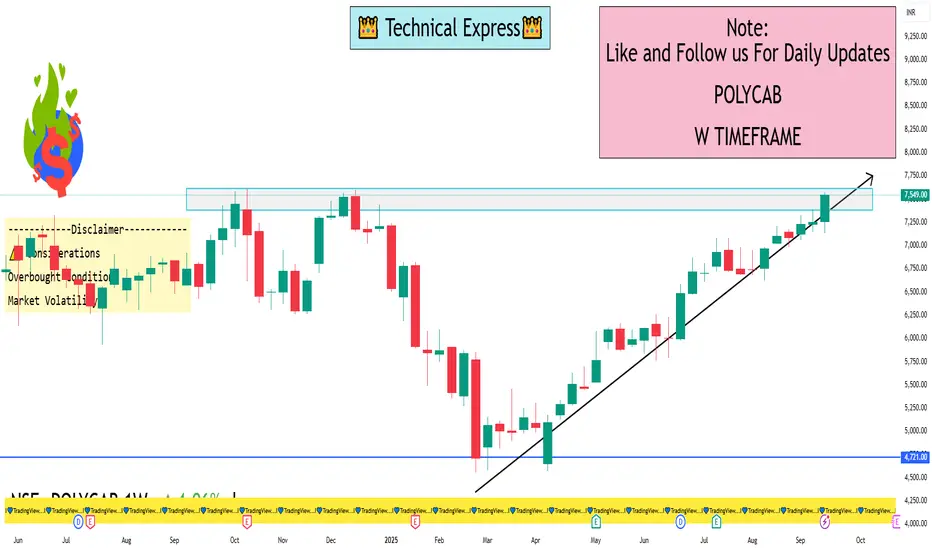
Over the past week, Polycab's stock has demonstrated a strong bullish trend, supported by several key technical indicators:
Technical Ratings: Both daily and weekly analyses indicate a "Strong Buy" signal, suggesting sustained upward momentum.
Relative Strength Index (RSI): The weekly RSI stands at 85.19, indicating the stock is in overbought territory, which may suggest a potential short-term pullback.
Support and Resistance Levels:
Immediate Support: ₹7,193
Immediate Resistance: ₹7,890
Medium-Term Resistance: ₹8,693.86
Long-Term Resistance: ₹9,068.70
Long-Term Support: ₹6,000.50
Trend Indicators: Moving averages and other technical indicators are aligned with a bullish trend, supporting the "Strong Buy" signal.
⚠️ Considerations
Overbought Conditions: The high RSI suggests the stock may be due for a short-term consolidation or pullback.
Market Volatility: Investors should be aware of potential market fluctuations that could impact stock performance.
📊 Summary
Polycab India Ltd. is exhibiting strong bullish momentum on the weekly timeframe. While the stock's overbought condition warrants caution, the overall technical indicators support a positive outlook. Investors should monitor key support and resistance levels and consider potential short-term corrections as part of their investment strategy.
I built a Buy & Sell Signal Indicator with 85% accuracy.
📈 Get access via DM or
WhatsApp: wa.link/d997q0
Contact - +91 76782 40962
| Email: techncialexpress@gmail.com
| Script Coder | Trader | Investor | From India
📈 Get access via DM or
WhatsApp: wa.link/d997q0
Contact - +91 76782 40962
| Email: techncialexpress@gmail.com
| Script Coder | Trader | Investor | From India
관련 발행물
면책사항
해당 정보와 게시물은 금융, 투자, 트레이딩 또는 기타 유형의 조언이나 권장 사항으로 간주되지 않으며, 트레이딩뷰에서 제공하거나 보증하는 것이 아닙니다. 자세한 내용은 이용 약관을 참조하세요.