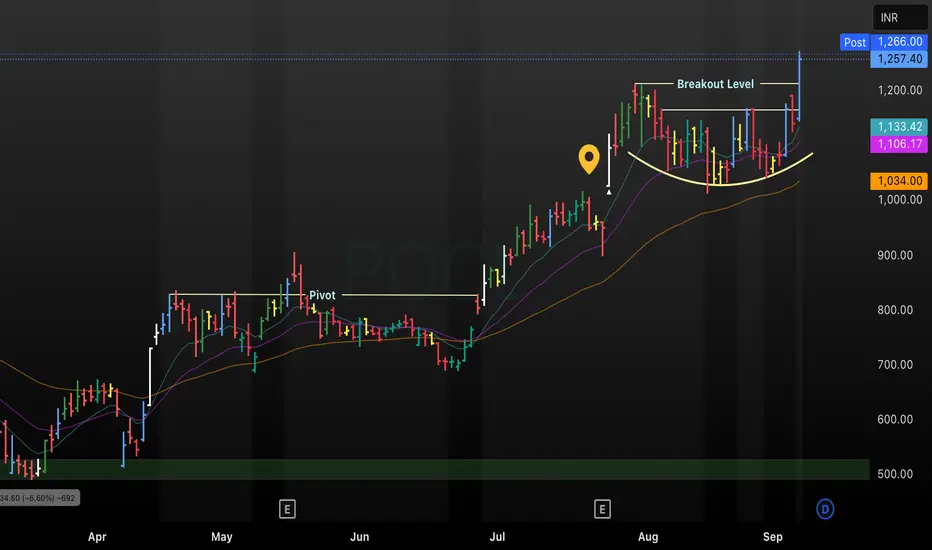
This annotated POCL daily chart tracks price movement from April to September 2025, displaying key technical events including a consolidation pivot, formation of a rounded base, and recent breakout above a major resistance level. Multiple moving averages (including short, medium, and long-term) support bullish momentum, with price closing above the breakout level and confirming a new uptrend. The setup provides trade entry signals and evidence of strengthening market structure for POCL as of September 20
면책사항
해당 정보와 게시물은 금융, 투자, 트레이딩 또는 기타 유형의 조언이나 권장 사항으로 간주되지 않으며, 트레이딩뷰에서 제공하거나 보증하는 것이 아닙니다. 자세한 내용은 이용 약관을 참조하세요.
면책사항
해당 정보와 게시물은 금융, 투자, 트레이딩 또는 기타 유형의 조언이나 권장 사항으로 간주되지 않으며, 트레이딩뷰에서 제공하거나 보증하는 것이 아닙니다. 자세한 내용은 이용 약관을 참조하세요.