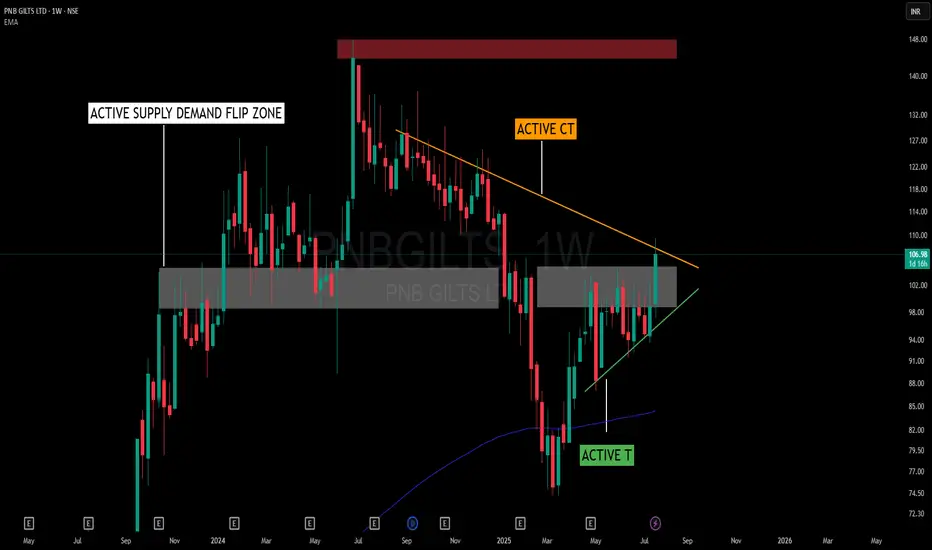
This chart presents an interesting interaction between structure and zone dynamics without adhering to a textbook pattern name. The price is being squeezed within a random, yet well-defined structural form, shaped by the forces of support and resistance.
📌 Key Structural Notes:
🟠 Active Counter Trendline (CT) – Acting as overhead resistance, capping price for several weeks.
🟢 Rising Trendline (T) – Offering a base of support, encouraging higher lows and structural tightening.
🟫 Supply-Demand Flip Zone – A previously reactive supply zone now serving a dual role, showing consistent relevance to price behavior.
🟥 Major Supply Overhead – Remains untested, yet significant from a broader structure perspective.
Rather than labeling this as a triangle or cup-handle, it’s more about how CT and T are working together to compress price into a decision area. The presence of the flip zone adds to the friction, making this a valuable case to observe from a structural and behavioral standpoint.
🧠 Not a prediction or setup – just a visual study of how structure evolves when opposing pressures meet within a contextual zone.
🎯 Master My Self-Made Trading Strategy
📈 Telegram (Learn Today): t.me/hashtaghammer
✅ WhatsApp (Learn Today): wa.me/919455664601
📈 Telegram (Learn Today): t.me/hashtaghammer
✅ WhatsApp (Learn Today): wa.me/919455664601
관련 발행물
면책사항
해당 정보와 게시물은 금융, 투자, 트레이딩 또는 기타 유형의 조언이나 권장 사항으로 간주되지 않으며, 트레이딩뷰에서 제공하거나 보증하는 것이 아닙니다. 자세한 내용은 이용 약관을 참조하세요.