🏛️ Research Notes
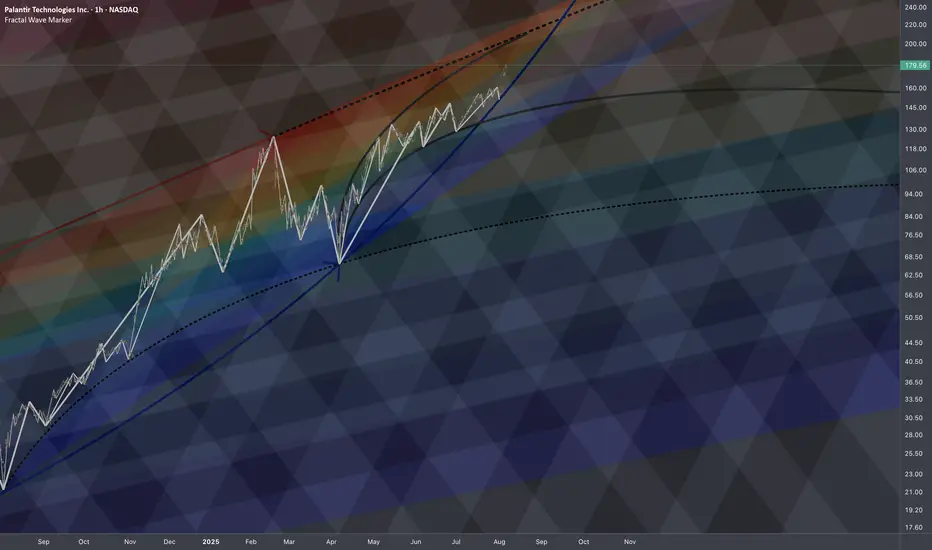
The fact that price touched and reflected up from the curve that mimics exponential growth, forced me to focus on the precursors that could explain the geometry of such decisive move.
Let's strip the chart and document how exactly chronological chain of human emotions were progressing across vast cycles.
Publishing interactive chart as low as 1h TF to observe in details.
The fact that price touched and reflected up from the curve that mimics exponential growth, forced me to focus on the precursors that could explain the geometry of such decisive move.
Let's strip the chart and document how exactly chronological chain of human emotions were progressing across vast cycles.
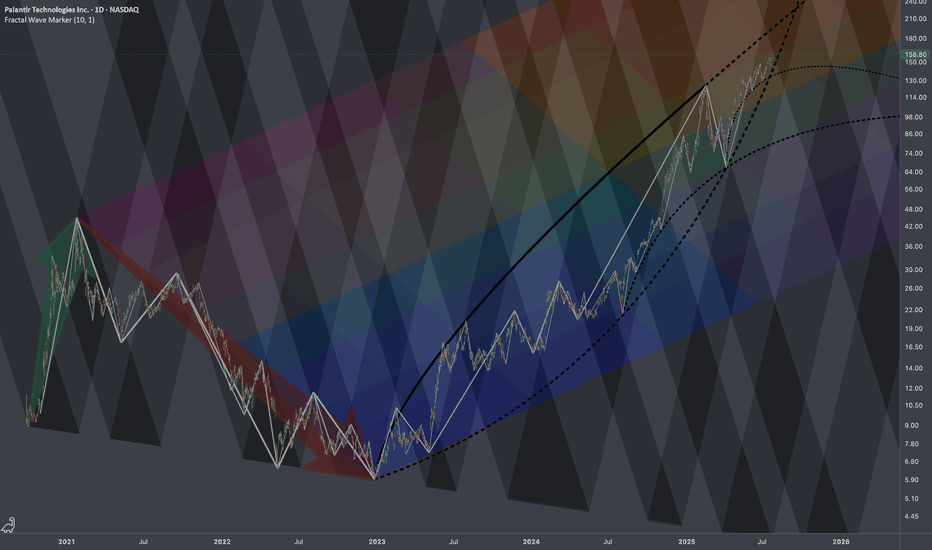
- Essentially, the composite sub-cycles patterns are the same but stretched towards denser probability point. It's not just percentages that matter, but how it was structured on the way down. Evidently that was enough to trigger exponential growth. (BTW, since that super-bottom price is up 2950%)
- So, that force made the time tick differently in the following bigger cycle. Manifests in frequency of reversals of sub-waves and changing scaling laws.
- Particular parts of large curves with gradient of last reaction move can be connected to further express how two forces push the price toward some mutual angle.
Publishing interactive chart as low as 1h TF to observe in details.
액티브 트레이드
Documenting Highlights◇ Crossed below exponential curve
◇ Landed on logistic curve
Unlock exclusive tools: fractlab.com
ᴀʟʟ ᴄᴏɴᴛᴇɴᴛ ᴘʀᴏᴠɪᴅᴇᴅ ʙʏ ꜰʀᴀᴄᴛʟᴀʙ ɪꜱ ɪɴᴛᴇɴᴅᴇᴅ ꜰᴏʀ ɪɴꜰᴏʀᴍᴀᴛɪᴏɴᴀʟ ᴀɴᴅ ᴇᴅᴜᴄᴀᴛɪᴏɴᴀʟ ᴘᴜʀᴘᴏꜱᴇꜱ ᴏɴʟʏ.
ᴘᴀꜱᴛ ᴘᴇʀꜰᴏʀᴍᴀɴᴄᴇ ɪꜱ ɴᴏᴛ ɪɴᴅɪᴄᴀᴛɪᴠᴇ ᴏꜰ ꜰᴜᴛᴜʀᴇ ʀᴇꜱᴜʟᴛꜱ.
ᴀʟʟ ᴄᴏɴᴛᴇɴᴛ ᴘʀᴏᴠɪᴅᴇᴅ ʙʏ ꜰʀᴀᴄᴛʟᴀʙ ɪꜱ ɪɴᴛᴇɴᴅᴇᴅ ꜰᴏʀ ɪɴꜰᴏʀᴍᴀᴛɪᴏɴᴀʟ ᴀɴᴅ ᴇᴅᴜᴄᴀᴛɪᴏɴᴀʟ ᴘᴜʀᴘᴏꜱᴇꜱ ᴏɴʟʏ.
ᴘᴀꜱᴛ ᴘᴇʀꜰᴏʀᴍᴀɴᴄᴇ ɪꜱ ɴᴏᴛ ɪɴᴅɪᴄᴀᴛɪᴠᴇ ᴏꜰ ꜰᴜᴛᴜʀᴇ ʀᴇꜱᴜʟᴛꜱ.
면책사항
해당 정보와 게시물은 금융, 투자, 트레이딩 또는 기타 유형의 조언이나 권장 사항으로 간주되지 않으며, 트레이딩뷰에서 제공하거나 보증하는 것이 아닙니다. 자세한 내용은 이용 약관을 참조하세요.