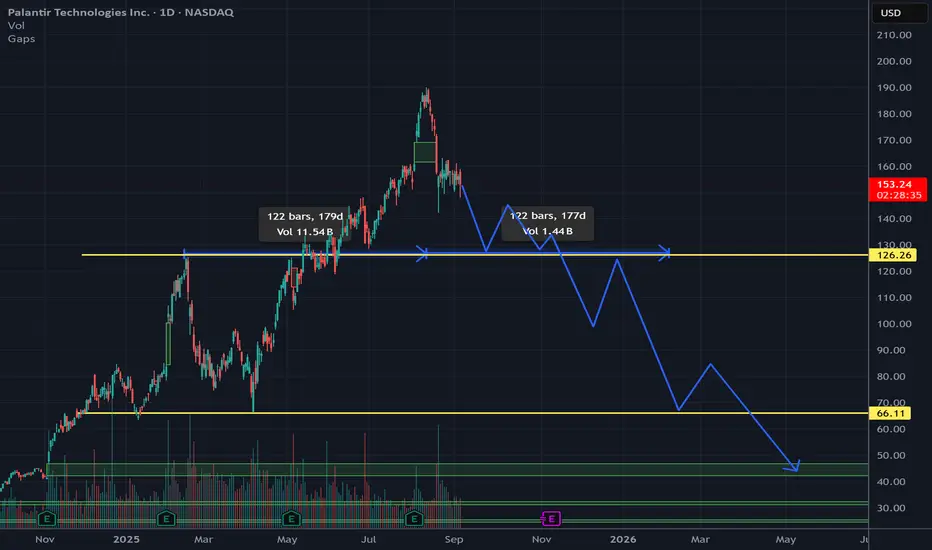
Over 180 days, PLTR climbed aggressively, fueled by high conviction buying. With candlesticks showing strong green bodies and upside momentum, peaking near the $190 52-week high.
This analysis focuses on the fractal comparison in the chart, forecasting an extended bearish phase that could drag the stock significantly lower before any stabilization.
I predict PLTR enters an extended correction phase. This fractal symmetry suggests the downside could match or exceed the prior upside's duration and magnitude, projecting a measured move toward $65 or lower
면책사항
이 정보와 게시물은 TradingView에서 제공하거나 보증하는 금융, 투자, 거래 또는 기타 유형의 조언이나 권고 사항을 의미하거나 구성하지 않습니다. 자세한 내용은 이용 약관을 참고하세요.
면책사항
이 정보와 게시물은 TradingView에서 제공하거나 보증하는 금융, 투자, 거래 또는 기타 유형의 조언이나 권고 사항을 의미하거나 구성하지 않습니다. 자세한 내용은 이용 약관을 참고하세요.