$PLTR Palentir - 4 hour - trend matrix development
A trend matrix, also known as a trend analysis matrix, is a tool used to analyze and visualize trends in data over time. It helps in identifying patterns, making forecasts, and making informed decisions based on historical data. Developing a trend matrix involves several steps:
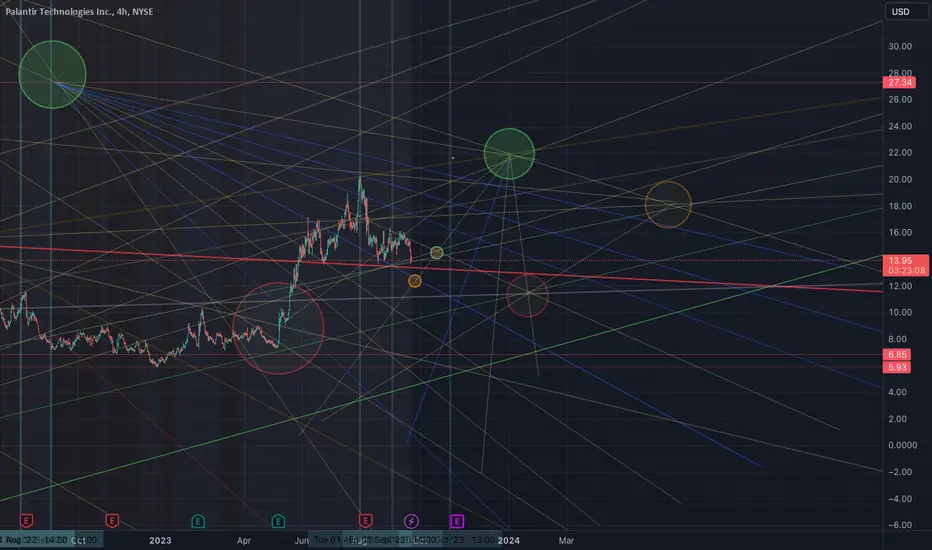
A geometric trendline matrix is a visual representation of geometric trends in data over time. Geometric trends are characterized by a constant ratio of change rather than a constant amount of change, which is typical of linear trends.
The ratio degrades to a 0 point hub. Which often acts as a sort of cog to the movement of the dataflow.
This is a 4 hour chart of Palentir
면책사항
이 정보와 게시물은 TradingView에서 제공하거나 보증하는 금융, 투자, 거래 또는 기타 유형의 조언이나 권고 사항을 의미하거나 구성하지 않습니다. 자세한 내용은 이용 약관을 참고하세요.
면책사항
이 정보와 게시물은 TradingView에서 제공하거나 보증하는 금융, 투자, 거래 또는 기타 유형의 조언이나 권고 사항을 의미하거나 구성하지 않습니다. 자세한 내용은 이용 약관을 참고하세요.