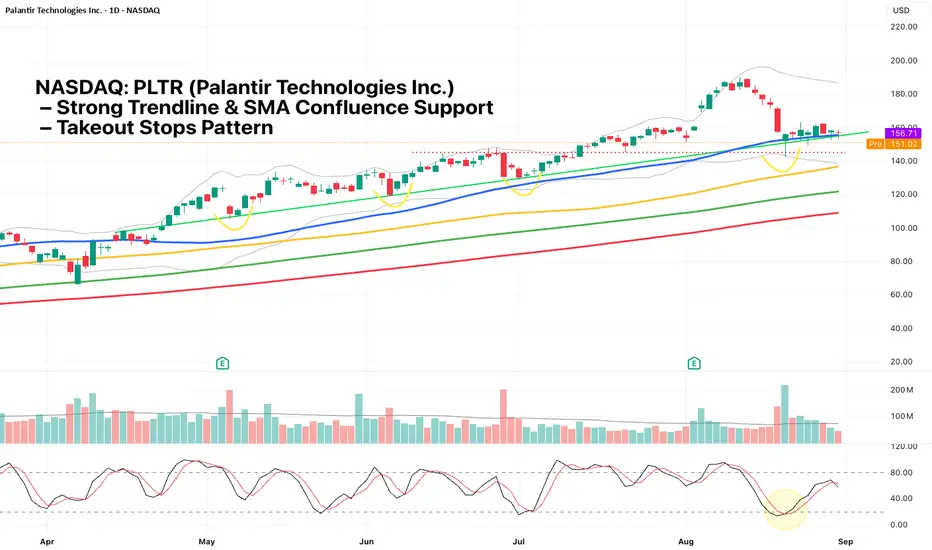
NASDAQ: PLTR Palantir remains in a clear uptrend with the moving averages aligned (SMA 50 > SMA 100 > SMA 150 > SMA 200). Since April, price has consistently traded above the 50-day SMA, finding support on each pullback to the trendline (green line). This trendline has been tested four times over the past six months, the latest on August 20.
On August 20, PLTR formed a hammer candlestick while testing multiple key supports simultaneously:
1) Horizontal support (red dotted line)
2) Cut Lower Bollinger Band
3) Tested 50-day SMA
4) Trendline support (green line)
5) Stochastic in oversold zone
6) Takeout stops pattern: wick flushed below prior lows, likely taking out stops before reversing
This strong confluence of signals suggests buyers are defending the level, offering a favorable risk-reward setup.
I follow price, not predictions.
Trends speak louder than opinions.
Follow me to stay updated with my latest trade setups.
Trends speak louder than opinions.
Follow me to stay updated with my latest trade setups.
면책사항
이 정보와 게시물은 TradingView에서 제공하거나 보증하는 금융, 투자, 거래 또는 기타 유형의 조언이나 권고 사항을 의미하거나 구성하지 않습니다. 자세한 내용은 이용 약관을 참고하세요.