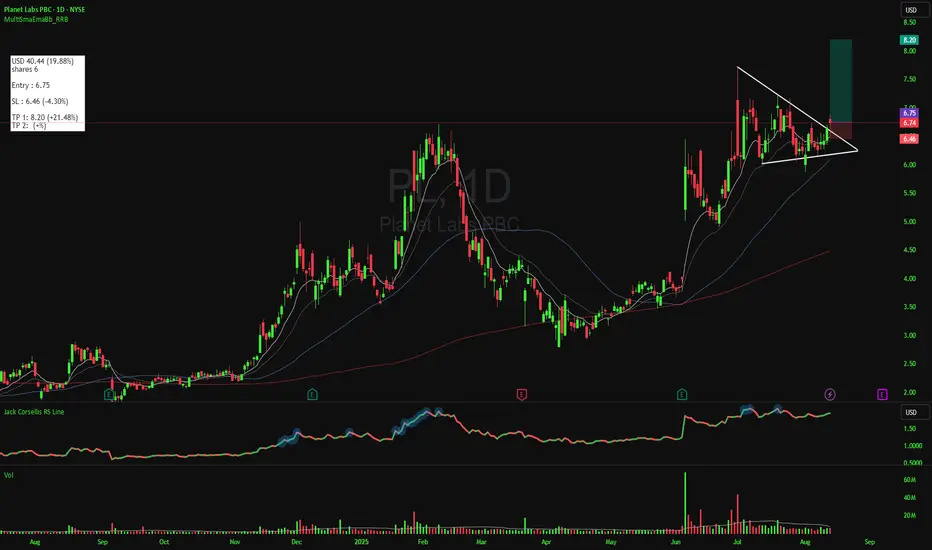
There is also a breakout from Bullish Pennant Pattern, but did not occur on a green candle, which raises concern about whether this is a valid breakout.Still, it's worth keeping an eye on.
Futhermore, the stock is making new highs, as shown by the indicator below (Jack Corsellis RS Line), where a blue light appears when the stock reaches a new high.
Moreover, volume was very low while the price was forming the pattern, which is what we want. The next step is we need to see a breakout with a solid green candle and supported by large volume exceeding the 30-day moving average.
Lastly, earnings per Share (EPS) have shown a recovery from the last quarter, improving from -0.12 in 2025/Q4 to -0.04 in 2026/Q1.
면책사항
해당 정보와 게시물은 금융, 투자, 트레이딩 또는 기타 유형의 조언이나 권장 사항으로 간주되지 않으며, 트레이딩뷰에서 제공하거나 보증하는 것이 아닙니다. 자세한 내용은 이용 약관을 참조하세요.
면책사항
해당 정보와 게시물은 금융, 투자, 트레이딩 또는 기타 유형의 조언이나 권장 사항으로 간주되지 않으며, 트레이딩뷰에서 제공하거나 보증하는 것이 아닙니다. 자세한 내용은 이용 약관을 참조하세요.