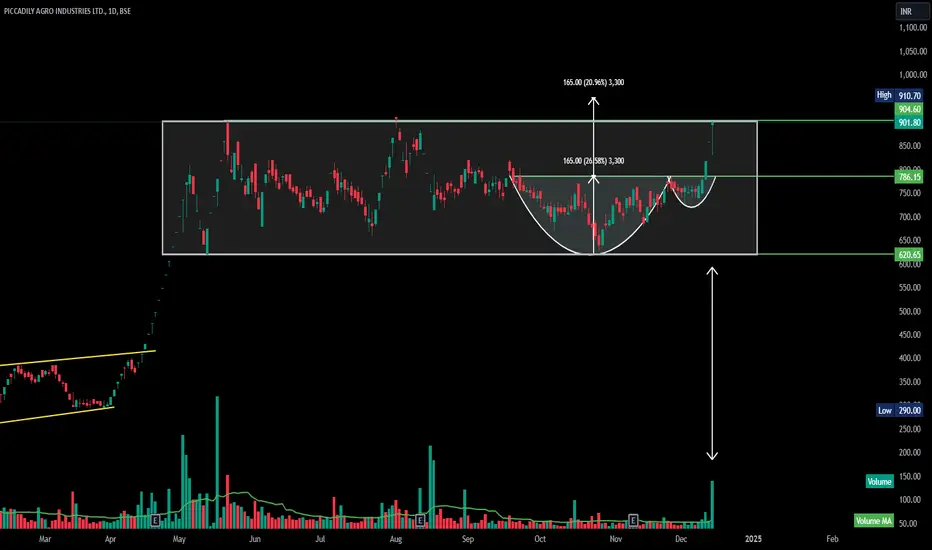
This chart **Piccadily Agro Industries Ltd.** (PICCADIL) on the **BSE**.
Here are the key technical observations:
1. **Pattern:**
- An **cup-and-handle pattern** is identified, which is typically a bullish continuation setup.
- The price has confirmed a breakout above the handle's resistance.
2. Consolidation Breakout:
-The price has successfully broken out of the 900 resistance with strong bullish momentum.
-The breakout represents the end of the multi-month consolidation phase since April 2024,
confirming a significant bullish bias.
- The breakout has occurred on high volume, confirming buying interest and enhancing the
reliability of the pattern.
3. Measured Target:
The expected upward move is calculated based on the depth of the cup:
Height of the cup ≈ 165 points.
Target post-breakout = Breakout level (786.15) + Depth of the cup (165) = ~951.15.
This aligns with the chart showing a potential 20.96% upside.
4. **Key Levels:**
Support Levels:
786.15: Now a key support after the breakout.
620.65: Strong base support for the pattern.
Resistance Levels:
904.60: Immediate resistance, just below the target zone.
951.15–960.00: Projected target based on the measured move.
5. **Volume Analysis:**
- Sustained increases in volume around the breakout region suggest institutional buying.
면책사항
해당 정보와 게시물은 금융, 투자, 트레이딩 또는 기타 유형의 조언이나 권장 사항으로 간주되지 않으며, 트레이딩뷰에서 제공하거나 보증하는 것이 아닙니다. 자세한 내용은 이용 약관을 참조하세요.
면책사항
해당 정보와 게시물은 금융, 투자, 트레이딩 또는 기타 유형의 조언이나 권장 사항으로 간주되지 않으며, 트레이딩뷰에서 제공하거나 보증하는 것이 아닙니다. 자세한 내용은 이용 약관을 참조하세요.