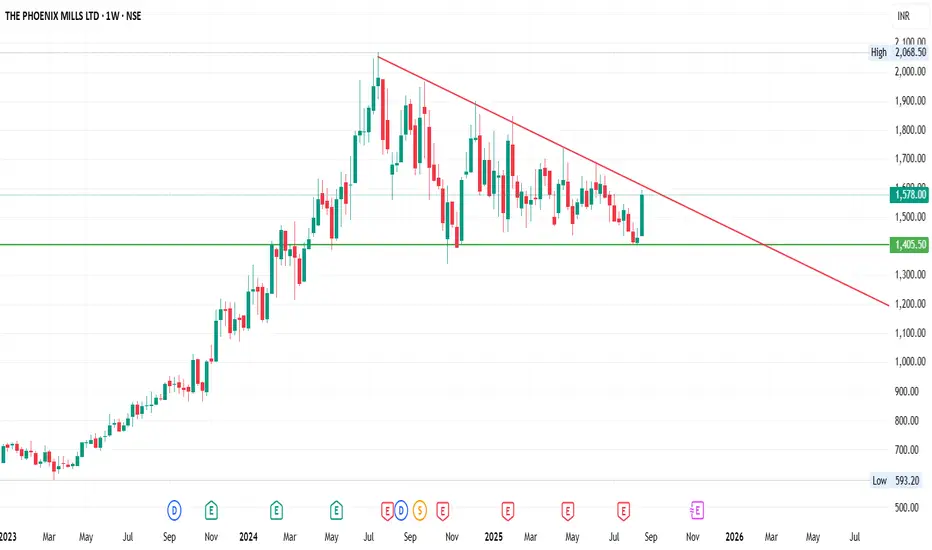
Chart Pattern: On the weekly chart, Phoenix Ltd. is forming a triangle consolidation pattern after a strong prior uptrend.
Technical View
Support Zone: ₹1400 (strong base, tested multiple times).
Resistance Trendline: Descending resistance capping the upside.
Volume: Watch for a surge in volume to confirm breakout direction.
Breakout Levels:
What do you think? Will Phoenix Ltd. break upwards or downwards? Drop your views below!
Disclaimer: This analysis is for educational purposes only, not financial advice. Please do your own research before investing.
- The descending trendline (red) is acting as resistance.
- A strong horizontal support zone near ₹1400 (green) has been tested multiple times, showing buyers’ interest at this level.
- Price action is currently squeezing inside the triangle, indicating that a big breakout move may be near.
Technical View
Support Zone: ₹1400 (strong base, tested multiple times).
Resistance Trendline: Descending resistance capping the upside.
Volume: Watch for a surge in volume to confirm breakout direction.
Breakout Levels:
- Bullish breakout above the descending trendline could open up targets towards ₹1600–₹1700.
- Be
What do you think? Will Phoenix Ltd. break upwards or downwards? Drop your views below!
Disclaimer: This analysis is for educational purposes only, not financial advice. Please do your own research before investing.
면책사항
해당 정보와 게시물은 금융, 투자, 트레이딩 또는 기타 유형의 조언이나 권장 사항으로 간주되지 않으며, 트레이딩뷰에서 제공하거나 보증하는 것이 아닙니다. 자세한 내용은 이용 약관을 참조하세요.
면책사항
해당 정보와 게시물은 금융, 투자, 트레이딩 또는 기타 유형의 조언이나 권장 사항으로 간주되지 않으며, 트레이딩뷰에서 제공하거나 보증하는 것이 아닙니다. 자세한 내용은 이용 약관을 참조하세요.