Here’s a summary of the latest intraday data:
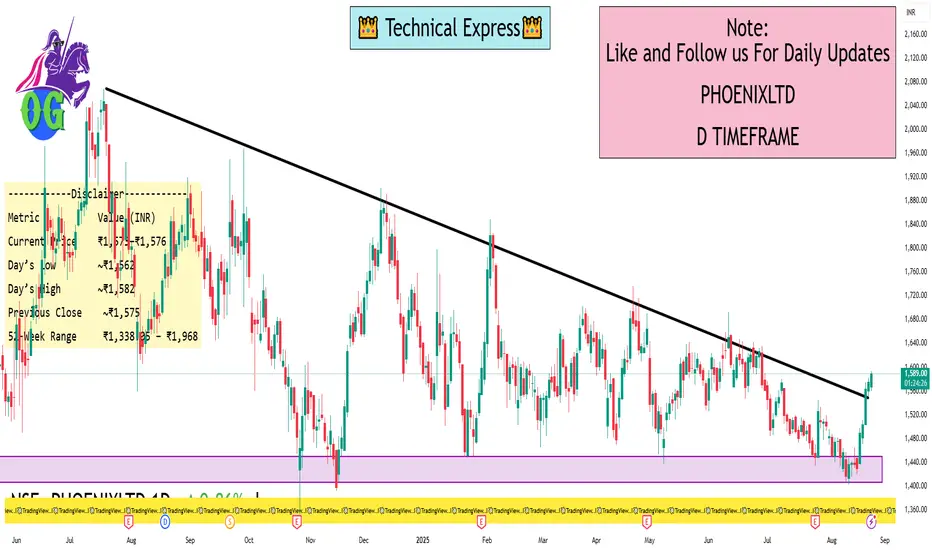
Current price: Approximately ₹1,573.00–₹1,576.00
Daily range: Between ₹1,562.00 (low) and ₹1,582.50 (high)
Previous closing price: Around ₹1,575.50
52-week range: ₹1,338.05 — ₹1,968.00
Specifically:
TradingView reports a current price of ₹1,575.50, showing a gain of ~0.76% in the last 24 hours. Day’s range is consistent with ₹1,562.00–₹1,582.50
Screener shows the price at ₹1,573 as of 10:44 a.m. IST today
Investing.com indicates the stock is trading at ₹1,575.50, with day’s range and 52-week range matching other sources
Financial Times Markets Data confirms intraday trading between ₹1,560.40 and ₹1,582.50, with previous close at₹1,575.00
Suggested Next Steps
Charting Platforms – Sites like TradingView, Investing.com, or Moneycontrol offer real-time intraday charts. These let you analyze key levels such as open, high, low, VWAP, and volume trends.
Technical Indicators – To identify support and resistance, you might want to apply indicators like moving averages (e.g., 20/50 EMA), RSI, or VWAP.
Alerts and Watchlists – Set price alerts around critical levels (e.g., ₹1,562 or ₹1,582) to stay informed of key moves.
Volume Analysis – Intraday volume can confirm the strength behind any move—higher volume on breakouts or dips is particularly telling.
I built a Buy & Sell Signal Indicator with 85% accuracy.
📈 Get access via DM or
WhatsApp: wa.link/d997q0
Contact - +91 76782 40962
| Email: techncialexpress@gmail.com
| Script Coder | Trader | Investor | From India
📈 Get access via DM or
WhatsApp: wa.link/d997q0
Contact - +91 76782 40962
| Email: techncialexpress@gmail.com
| Script Coder | Trader | Investor | From India
관련 발행물
면책사항
해당 정보와 게시물은 금융, 투자, 트레이딩 또는 기타 유형의 조언이나 권장 사항으로 간주되지 않으며, 트레이딩뷰에서 제공하거나 보증하는 것이 아닙니다. 자세한 내용은 이용 약관을 참조하세요.