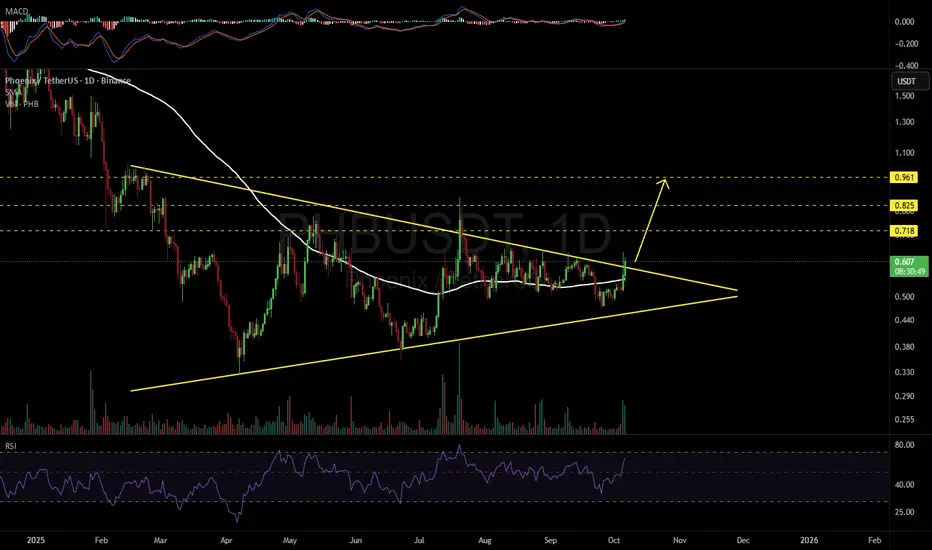
#PHB has broken above the symmetrical triangle resistance and the SMA100 on the daily chart. The increasing volume is a positive sign. If it manages to close the daily candle above the triangle, the potential targets are:
🎯 $0.718
🎯 $0.825
🎯 $0.961
⚠️ Always remember to use a tight stop-loss and maintain proper risk management.
🎯 $0.718
🎯 $0.825
🎯 $0.961
⚠️ Always remember to use a tight stop-loss and maintain proper risk management.
면책사항
이 정보와 게시물은 TradingView에서 제공하거나 보증하는 금융, 투자, 거래 또는 기타 유형의 조언이나 권고 사항을 의미하거나 구성하지 않습니다. 자세한 내용은 이용 약관을 참고하세요.
면책사항
이 정보와 게시물은 TradingView에서 제공하거나 보증하는 금융, 투자, 거래 또는 기타 유형의 조언이나 권고 사항을 의미하거나 구성하지 않습니다. 자세한 내용은 이용 약관을 참고하세요.