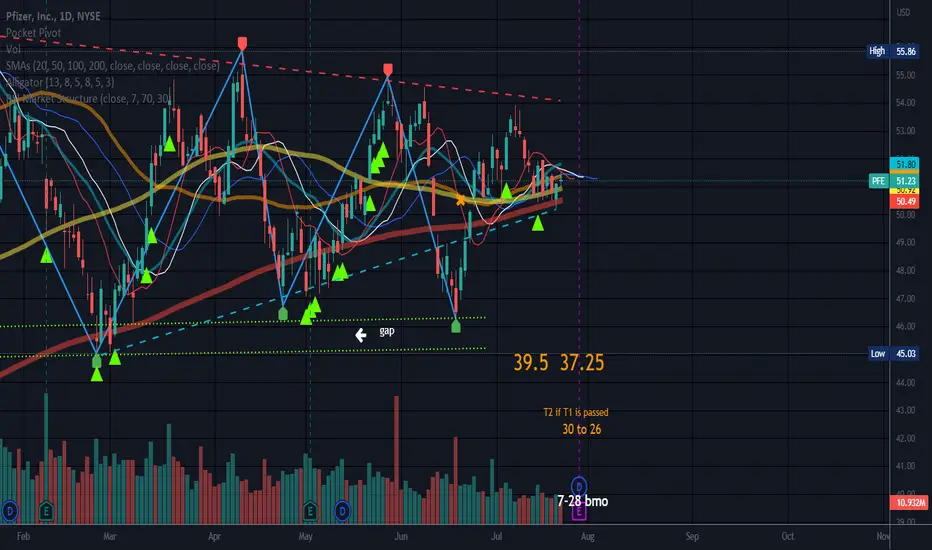
Earnings 7-28 BMO
Neutral pattern until a trendline is broken.
Targets over the triangle are bullish targets if triangle breaks to the upside.
Targets below the structure are bearish targets if this breaks to the downside.
Price has broken bottom trendline of the triangle and recovered using a prior gap as support.
Doji candle on Friday/indecision.
Short percent is 1.23% approximate and ratio is 2.9.
Earnings can make going long or short tricky so I will wait and see what happens. Longer term I feel this is a short due to the rising wedge. You may see this chart differently than I do.
No recommendation.
There is an old bearish rising wedge ( LOOK LEFT) in this chart just below $40. This pattern has not been validated. This pattern is not valid until the bottom trendline is broken. If history repeats itself, this rising wedge will eventually be broken.
면책사항
해당 정보와 게시물은 금융, 투자, 트레이딩 또는 기타 유형의 조언이나 권장 사항으로 간주되지 않으며, 트레이딩뷰에서 제공하거나 보증하는 것이 아닙니다. 자세한 내용은 이용 약관을 참조하세요.
면책사항
해당 정보와 게시물은 금융, 투자, 트레이딩 또는 기타 유형의 조언이나 권장 사항으로 간주되지 않으며, 트레이딩뷰에서 제공하거나 보증하는 것이 아닙니다. 자세한 내용은 이용 약관을 참조하세요.