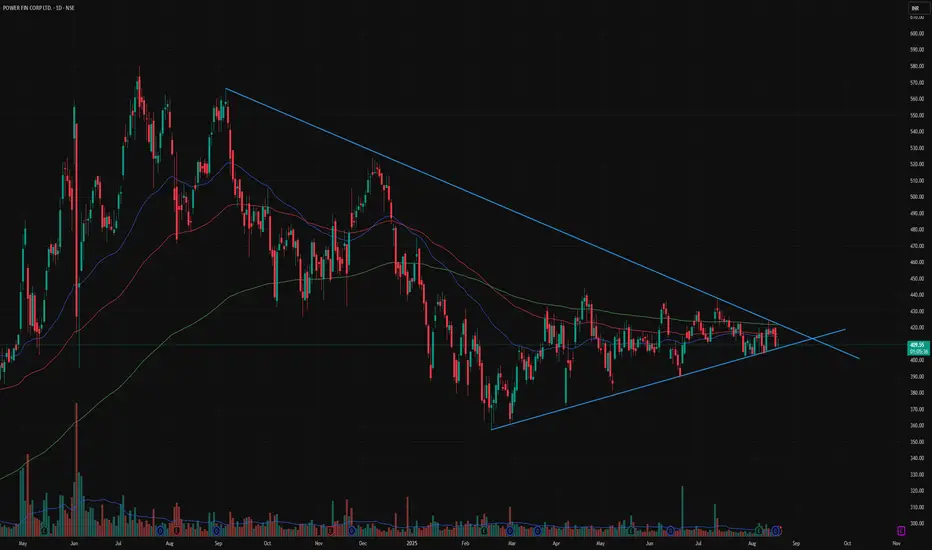
📊 Stock: Power Finance Corporation (PFC)
🔹 Symmetrical triangle pattern forming – price squeezing into apex
🔹 Long consolidation with volume stability – accumulation signs visible
🔹 Holding support near rising trendline (₹405–410)
🔹 Facing resistance near falling trendline (₹425–430)
🔹 Trading around 50, 100 & 200 DMA cluster – decisive move expected
🔹 RSI hovering near neutral – waiting for direction
🔹 Fundamentally strong PSU with consistent dividend payouts
⚡ Price tightening near breakout zone (₹425–430)
🚀 Breakout above resistance could trigger 20–25% rally towards ₹500+
⚠️ Breakdown below ₹400 may drag stock back to ₹370 levels.
면책사항
해당 정보와 게시물은 금융, 투자, 트레이딩 또는 기타 유형의 조언이나 권장 사항으로 간주되지 않으며, 트레이딩뷰에서 제공하거나 보증하는 것이 아닙니다. 자세한 내용은 이용 약관을 참조하세요.
면책사항
해당 정보와 게시물은 금융, 투자, 트레이딩 또는 기타 유형의 조언이나 권장 사항으로 간주되지 않으며, 트레이딩뷰에서 제공하거나 보증하는 것이 아닙니다. 자세한 내용은 이용 약관을 참조하세요.