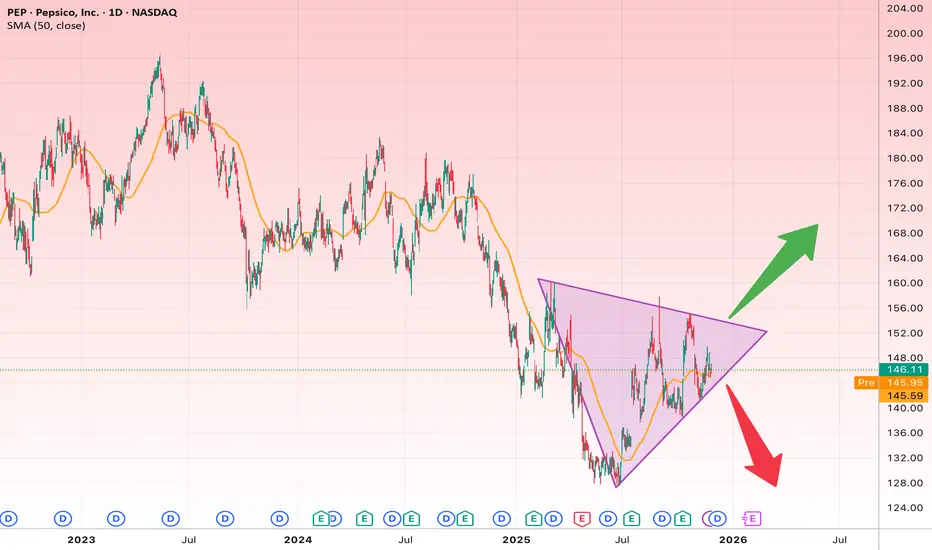
The PEP daily chart is forming a symmetrical triangle, a classic consolidation pattern that often leads to a strong breakout. Price has been bouncing between the upper and lower trendlines and is now positioned around the middle of the structure.
Bullish Scenario
If the price breaks above the upper trendline around $150–$152, a bullish continuation is likely.
Bullish Targets:
• Target 1: $160
• Target 2: $168
• Target 3: Up to $175 if momentum is strong
Bearish Scenario
Breaking below the lower triangle boundary (~$142) could trigger a deeper decline.
Bearish Targets:
• Target 1: $136
• Target 2: $130
Stop Loss
• For long positions: Below $142
• For short positions: Above $152
면책사항
해당 정보와 게시물은 금융, 투자, 트레이딩 또는 기타 유형의 조언이나 권장 사항으로 간주되지 않으며, 트레이딩뷰에서 제공하거나 보증하는 것이 아닙니다. 자세한 내용은 이용 약관을 참조하세요.
면책사항
해당 정보와 게시물은 금융, 투자, 트레이딩 또는 기타 유형의 조언이나 권장 사항으로 간주되지 않으며, 트레이딩뷰에서 제공하거나 보증하는 것이 아닙니다. 자세한 내용은 이용 약관을 참조하세요.