📈 PCBL – Breakout from Symmetrical Triangle | Bullish Momentum Building 🚀
📌 Symbol: PCBL CHEMICAL LTD – NSE
🕒 Timeframe: Daily
💰 CMP: ₹431.85 (+6.80%)
📆 Date: July 9, 2025
🔷 Technical Summary:
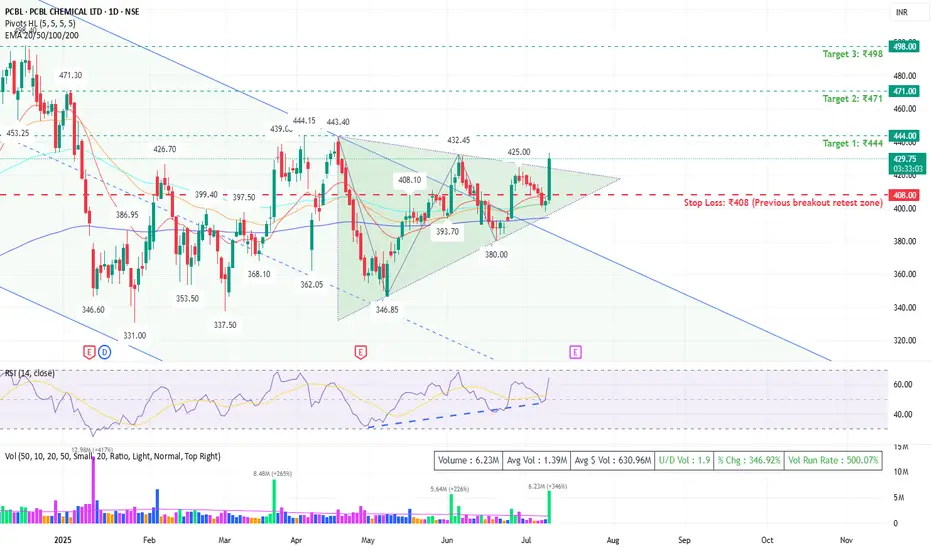
PCBL has given a strong breakout above a well-formed *symmetrical triangle* with significant volume support. Price action indicates trend reversal from a long-term falling channel.
✅ Key Bullish Signals:
• Symmetrical triangle breakout above ₹425
• Bullish engulfing candle with 271% spike in volume
• RSI at 65 – strong but not overbought
• Price trading above all major EMAs (20/50/100/200)
• Vol Run Rate: 390% – confirms strong market participation
📊 Support & Resistance Levels:
• Support: ₹408 / ₹393.70 / ₹362
• Resistance: ₹444.15 / ₹471.30 / ₹498.40
📈 Trade Setup (Positional):
• Buy Zone: ₹425–₹432 (on dips or sustained close above ₹432)
• Target 1: ₹444
• Target 2: ₹471
• Target 3: ₹498
• Stop Loss: ₹408 (below breakout zone)
🧠 Analyst Note:
This breakout comes after months of consolidation and offers a favorable risk-reward ratio. Watch for follow-through above ₹444–₹448 for confirmation of a larger uptrend.
📢 Disclaimer: This is not investment advice. Please consult your financial advisor before making any trading decisions.
면책사항
이 정보와 게시물은 TradingView에서 제공하거나 보증하는 금융, 투자, 거래 또는 기타 유형의 조언이나 권고 사항을 의미하거나 구성하지 않습니다. 자세한 내용은 이용 약관을 참고하세요.
면책사항
이 정보와 게시물은 TradingView에서 제공하거나 보증하는 금융, 투자, 거래 또는 기타 유형의 조언이나 권고 사항을 의미하거나 구성하지 않습니다. 자세한 내용은 이용 약관을 참고하세요.