PANW has staged a strong comeback from a major support zone, reclaiming its bullish channel and now knocking on the door of previous highs. With key indicators flashing early bullish signals, the stock is setting up for a potential breakout — but the overhead resistance remains a critical hurdle.
Technical Breakdown
Trend Structure
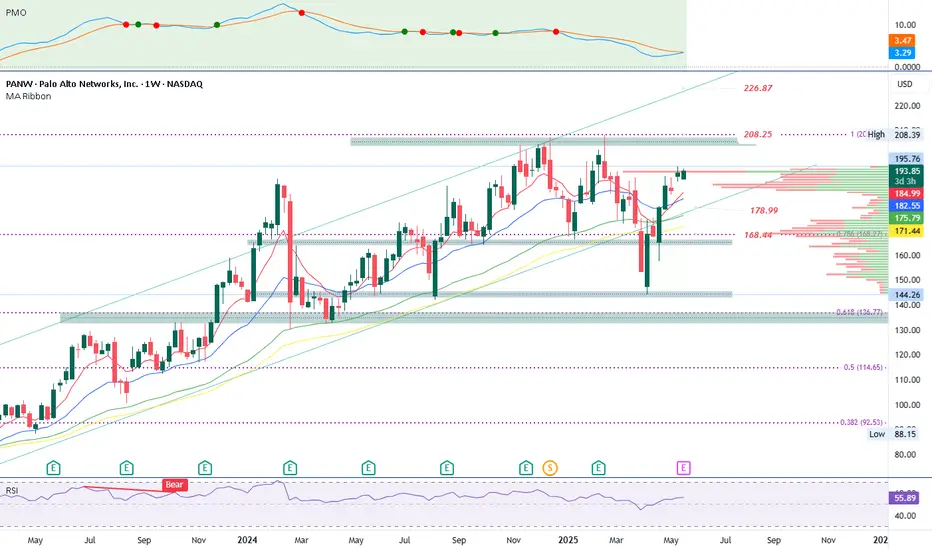
Rebounded from long-term demand zone (~$136–$145)
Back inside the ascending price channel
Testing major resistance at $208.25 (previous high)
Fibonacci Levels
0.786 retracement (support): $168.27 — respected perfectly
0.618 support zone: $136.77 — long-term base
Fib extension resistance: $226.87 — aligns with channel top
Indicators
PMO: Bullish crossover from bottom range; early upside signal
RSI: At 55.93, trending upward; plenty of room before overbought
Bullish Scenario
If PANW closes above $208.25 with volume:
Opens clean breakout potential to $226.87 (Fib extension & channel top)
Momentum indicators support trend continuation
Pullbacks toward $182–$185 likely to get bought aggressively
Trigger: Weekly close > $208.25
Target: $226.87
Support levels for re-entry: $185, $175, and $168
Bearish Scenario
If PANW gets rejected at $208.25:
Could form a double top and trigger a reversal
Breakdown below $175 would invalidate near-term bullish setup
Watch for retest of $168.27 (Fib + demand zone) — losing that risks flush toward $137
Trigger: Rejection at $208 + close below $175
Downside risk levels: $168 → $145 → $137
Final Thoughts
The weekly structure leans bullish — but the next $10 range is a battlefield. If buyers clear $208, there’s room to run. Until then, manage risk and watch for decisive confirmation before committing full capital.
면책사항
이 정보와 게시물은 TradingView에서 제공하거나 보증하는 금융, 투자, 거래 또는 기타 유형의 조언이나 권고 사항을 의미하거나 구성하지 않습니다. 자세한 내용은 이용 약관을 참고하세요.
면책사항
이 정보와 게시물은 TradingView에서 제공하거나 보증하는 금융, 투자, 거래 또는 기타 유형의 조언이나 권고 사항을 의미하거나 구성하지 않습니다. 자세한 내용은 이용 약관을 참고하세요.