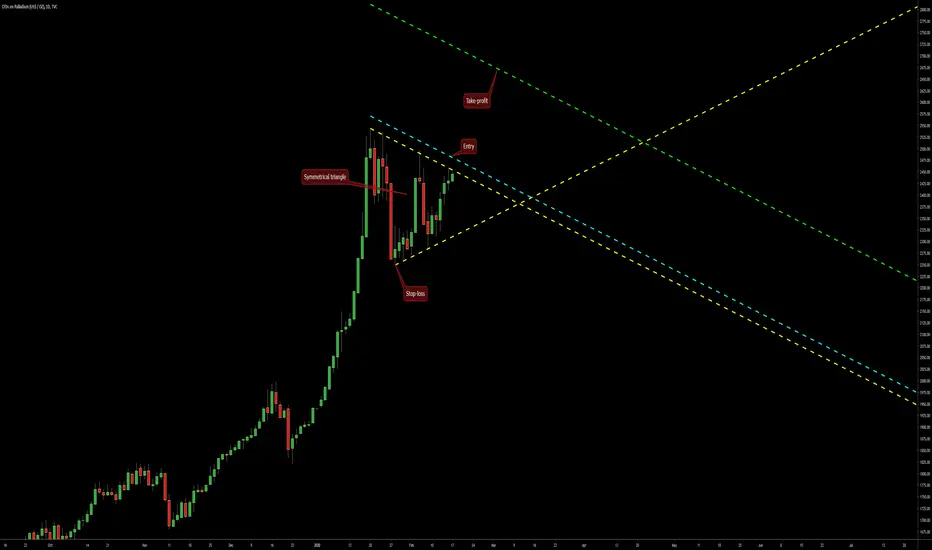
The symmetrical triangle on this daily chart of Palladium CFD offers an upside breakout trading opportunity. The triangle's borders are drawn using the yellow lines. My potential entry level will be at the cyan line. My potential take-profit level will be at the green line. I will use the low of the triangle's base as my stop-loss level (2249.0).
면책사항
해당 정보와 게시물은 금융, 투자, 트레이딩 또는 기타 유형의 조언이나 권장 사항으로 간주되지 않으며, 트레이딩뷰에서 제공하거나 보증하는 것이 아닙니다. 자세한 내용은 이용 약관을 참조하세요.
면책사항
해당 정보와 게시물은 금융, 투자, 트레이딩 또는 기타 유형의 조언이나 권장 사항으로 간주되지 않으며, 트레이딩뷰에서 제공하거나 보증하는 것이 아닙니다. 자세한 내용은 이용 약관을 참조하세요.