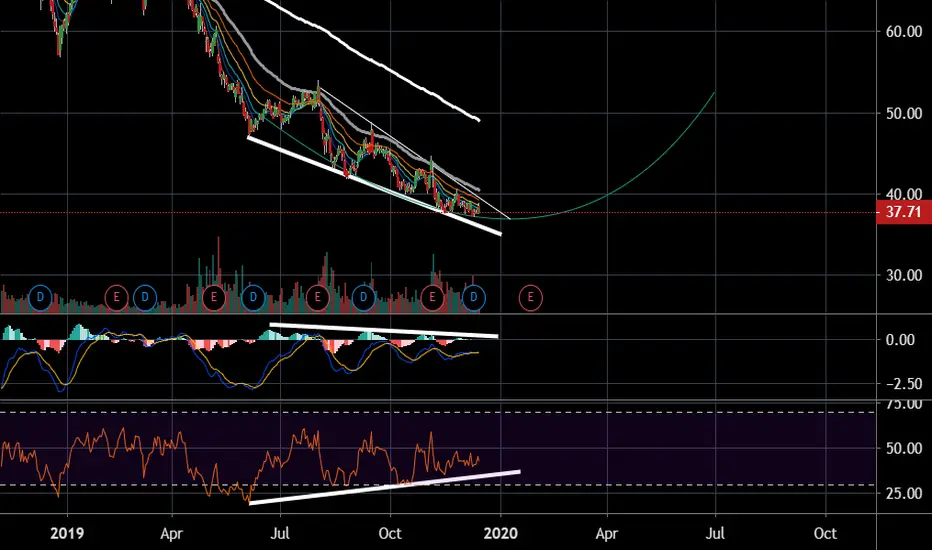
Taking a look at this down trending stock we can see that each lower low becomes less and less with the macd histogram becoming progressively smaller.
If we take a look at the RSI it is bullishly diverging a lot as notes by the higher lows on the rsi and the lower lows on the price action.
If we take a look at the pattern that it is forming it seems to be a falling wedge so a break out may be soon, especially if a some good new for oil comes to mind.
Moreover Warren buffet purchased shares of this company at a much higher price, so while I lack in my ability for fundamental analysis, I think that buying a shares cheaper than Berkshire Hathaway, who are expert investors would be a be plus as well.
노트
[img]seemed to have broken out and it is not showing much sign of weakness. IT seems to be creating an impulse wave on the hourly so we may be able catch it on a pullback before the third impulse wave starts.
면책사항
이 정보와 게시물은 TradingView에서 제공하거나 보증하는 금융, 투자, 거래 또는 기타 유형의 조언이나 권고 사항을 의미하거나 구성하지 않습니다. 자세한 내용은 이용 약관을 참고하세요.
면책사항
이 정보와 게시물은 TradingView에서 제공하거나 보증하는 금융, 투자, 거래 또는 기타 유형의 조언이나 권고 사항을 의미하거나 구성하지 않습니다. 자세한 내용은 이용 약관을 참고하세요.