The Big Question: Will We Finally See Moves on Alts?
The past month – or rather the past 6 weeks – has been nothing short of frustrating for altcoin traders. Most individual charts looked stagnant, choppy, or simply lacked momentum. But zooming out to the Total chart, the picture is much clearer, and the answer looks like a confident YES.
What the Chart Tells Us
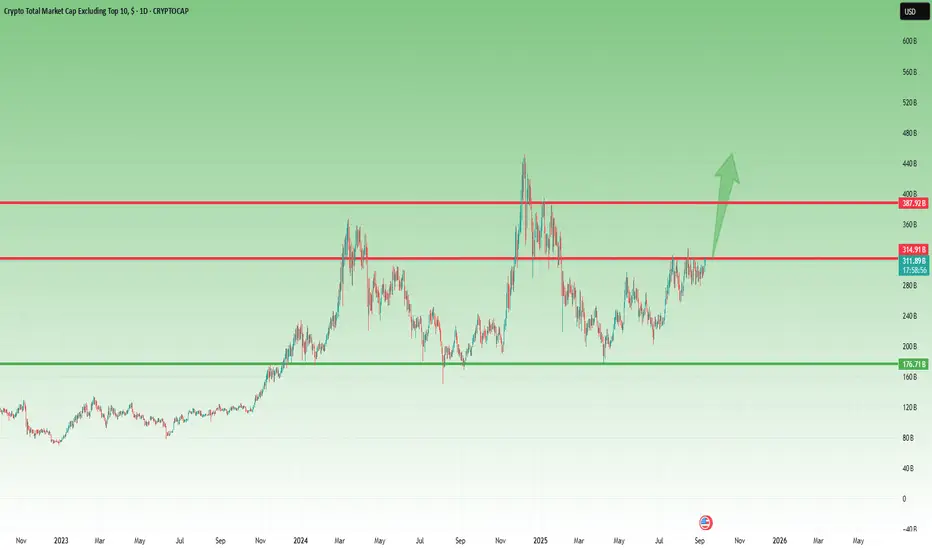
• After the December 2024 top, we witnessed a deep correction, which finally bottomed on 7 April, during the infamous tariff mania.
• From there, an initial leg up developed, reaching resistance around the 300B mark.
• The correction that followed was healthy: it established a higher low, confirming that the bottom was not just a dead cat bounce.
• The next attempt pushed even deeper into resistance, creating a higher high – a strong bullish sign.
• Since the end of July, things have turned even more interesting: the market has been pressing hard into resistance, and we could even argue the formation of a continuation Head & Shoulders setup.
Where We Are Now
At the time of posting, the Total chart is testing resistance at ~310B once again. The more this level gets tested, the weaker it becomes. A breakout from here doesn’t just look possible – it looks almost unavoidable.
What to Expect Next
When that resistance finally breaks, the tension built up over months of sideways action – and the frustration of traders who have been waiting for more than half a year – will likely unleash a strong acceleration.
In my view, we could easily see a 50% rally, taking the Total chart back to the December 2024 highs.
🚀 The stage is set. All that’s missing is the trigger.
The past month – or rather the past 6 weeks – has been nothing short of frustrating for altcoin traders. Most individual charts looked stagnant, choppy, or simply lacked momentum. But zooming out to the Total chart, the picture is much clearer, and the answer looks like a confident YES.
What the Chart Tells Us
• After the December 2024 top, we witnessed a deep correction, which finally bottomed on 7 April, during the infamous tariff mania.
• From there, an initial leg up developed, reaching resistance around the 300B mark.
• The correction that followed was healthy: it established a higher low, confirming that the bottom was not just a dead cat bounce.
• The next attempt pushed even deeper into resistance, creating a higher high – a strong bullish sign.
• Since the end of July, things have turned even more interesting: the market has been pressing hard into resistance, and we could even argue the formation of a continuation Head & Shoulders setup.
Where We Are Now
At the time of posting, the Total chart is testing resistance at ~310B once again. The more this level gets tested, the weaker it becomes. A breakout from here doesn’t just look possible – it looks almost unavoidable.
What to Expect Next
When that resistance finally breaks, the tension built up over months of sideways action – and the frustration of traders who have been waiting for more than half a year – will likely unleash a strong acceleration.
In my view, we could easily see a 50% rally, taking the Total chart back to the December 2024 highs.
🚀 The stage is set. All that’s missing is the trigger.
📈 Forex & XAU/USD Channel:
t.me/intradaytradingsignals
💎 Crypto Channel:
t.me/FanCryptocurrency
면책사항
이 정보와 게시물은 TradingView에서 제공하거나 보증하는 금융, 투자, 거래 또는 기타 유형의 조언이나 권고 사항을 의미하거나 구성하지 않습니다. 자세한 내용은 이용 약관을 참고하세요.
📈 Forex & XAU/USD Channel:
t.me/intradaytradingsignals
💎 Crypto Channel:
t.me/FanCryptocurrency
면책사항
이 정보와 게시물은 TradingView에서 제공하거나 보증하는 금융, 투자, 거래 또는 기타 유형의 조언이나 권고 사항을 의미하거나 구성하지 않습니다. 자세한 내용은 이용 약관을 참고하세요.