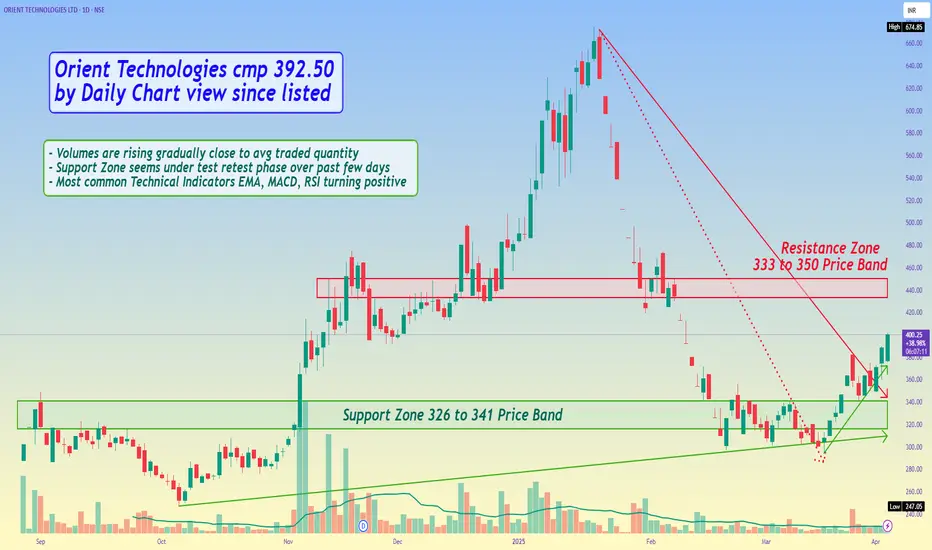
Orient Technologies cmp 392.50 by Daily Chart view since listed
- Support Zone 326 to 341 Price Band
- Resistance Zone 333 to 350 Price Band
- Volumes are rising gradually close to avg traded quantity
- Support Zone seems under test retest phase over past few days
- Most common Technical Indicators EMA, MACD, RSI turning positive
- Price sustaining above Falling Resistance Trendline and Rising Support Trendline
노트
Ooops My Bad.... Please read the Resistance Zone as 433 to 450 Price Band 면책사항
해당 정보와 게시물은 금융, 투자, 트레이딩 또는 기타 유형의 조언이나 권장 사항으로 간주되지 않으며, 트레이딩뷰에서 제공하거나 보증하는 것이 아닙니다. 자세한 내용은 이용 약관을 참조하세요.
면책사항
해당 정보와 게시물은 금융, 투자, 트레이딩 또는 기타 유형의 조언이나 권장 사항으로 간주되지 않으며, 트레이딩뷰에서 제공하거나 보증하는 것이 아닙니다. 자세한 내용은 이용 약관을 참조하세요.