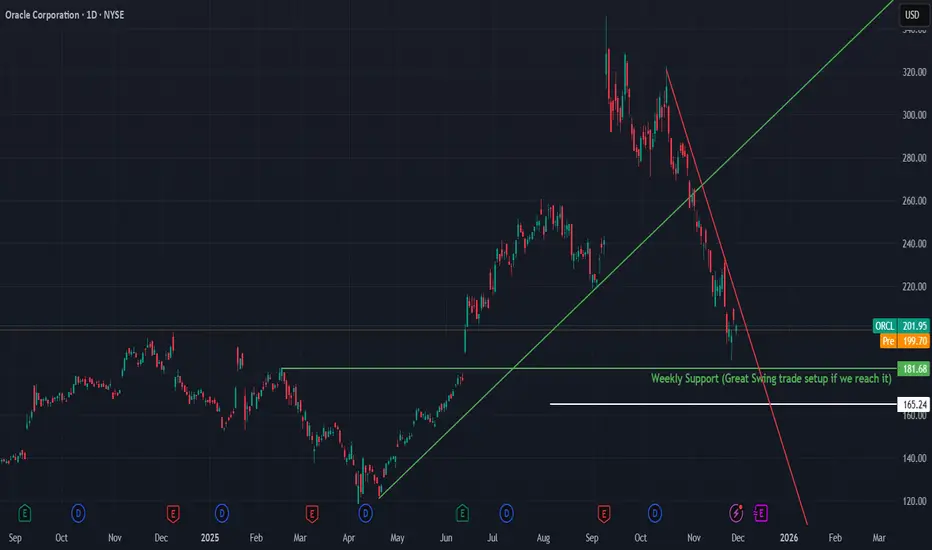
Oracle experienced a strong multi-month uptrend before breaking its major ascending trendline (green line). This break triggered a sharp downside move, forming a new short-term downtrend (red line). Price is now moving toward a critical weekly support at $181.68, which stands out as a major reaction zone.
🔍 Technical Analysis
Current Price: ~$202
Recent price action highlights:
A confirmed break of the long-term uptrend
A clean, accelerating downtrend in place
Price heading toward major weekly support at $181.68
Structure:
Clear downtrend with well-defined support levels that may offer strong risk–reward setups if reached.
🛡️ Support Zones (if pullback continues)
🟢 $181.68 | Stop-loss: $165
Major Weekly Support — Great swing trade setup if reached.
🧭 Outlook
There are three valid approaches depending on the trader’s style:
1️⃣ Enter now and wait
A trader may open a starter position before support is reached. This avoids the risk of missing the move entirely but requires patience as price develops.
2️⃣ Wait for the $181.68 weekly support
This is the cleanest structural level, but there is a real possibility price does not reach it, leaving no entry.
3️⃣ Wait for a break of the downtrend to go long
This is the safest confirmation-based entry. A breakout above the red trendline signals momentum reversal, but usually results in a higher entry price.
Bias:
Bullish only if $181.68 holds or if the red downtrend breaks.
🌍 Fundamental Insight
Oracle’s fundamentals remain intact despite the recent technical weakness. Cloud and AI infrastructure revenue (OCI) continues expanding, supported by strong cash flow, dividends, and buybacks. The correction reflects broader market tech volatility more than company-specific deterioration.
✅ Conclusion
Oracle is trading within a well-defined downtrend while approaching a major weekly support at $181.68.
This is one of the cleanest swing levels on the chart. Traders can choose between early positioning, waiting for the support, or waiting for trendline confirmation depending on their risk tolerance.
If you found this useful, don’t forget to like & follow for more structure-based insights.
관련 발행물
면책사항
해당 정보와 게시물은 금융, 투자, 트레이딩 또는 기타 유형의 조언이나 권장 사항으로 간주되지 않으며, 트레이딩뷰에서 제공하거나 보증하는 것이 아닙니다. 자세한 내용은 이용 약관을 참조하세요.
면책사항
해당 정보와 게시물은 금융, 투자, 트레이딩 또는 기타 유형의 조언이나 권장 사항으로 간주되지 않으며, 트레이딩뷰에서 제공하거나 보증하는 것이 아닙니다. 자세한 내용은 이용 약관을 참조하세요.