1️⃣ Overall Price Structure (Price Action)
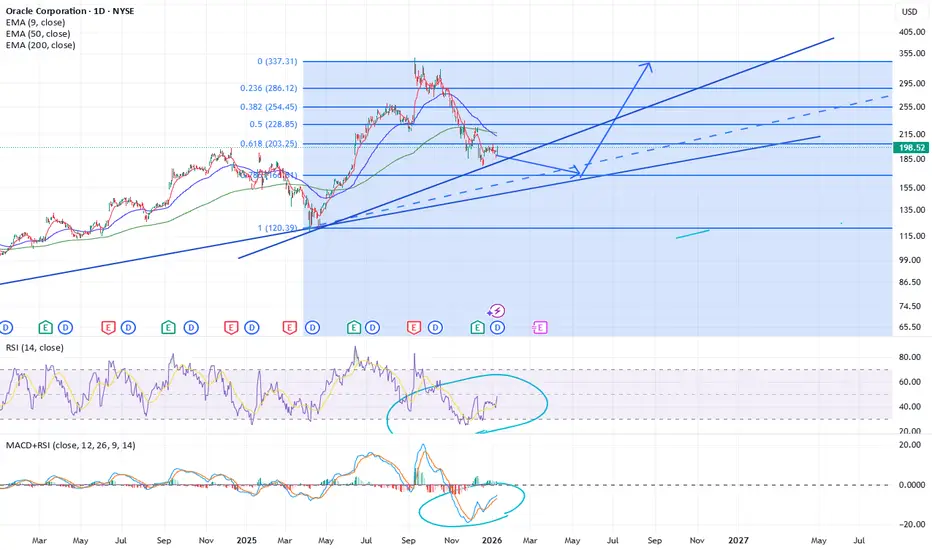
The long-term trend is still bullish (the ascending channel you drew is valid).
After topping around 300–320, price entered a deep correction.
Currently, price is trading near the lower boundary of the rising channel and a key support zone.
2️⃣ Fibonacci Levels
The Fibonacci levels you marked are very relevant:
0.618 ≈ $203 → Major support (price is hovering around this level now)
0.5 ≈ $228 → Mid resistance
0.382 ≈ $254 → Strong resistance
0.236 ≈ $286 → Heavy resistance
Previous high ≈ $330–340
📌 As long as $203 holds, the bullish scenario remains valid.
3️⃣ Moving Averages (EMA)
EMA 200 ≈ $217 → Price is below it → short-term weakness
EMA 50 ≈ $213 → Dynamic resistance
EMA 9 ≈ $194 → Price is slightly above it
📌 For a confirmed reversal:
Hold above EMA 9
Break and hold EMA 50
Reclaim EMA 200
4️⃣ RSI (14)
RSI is around 42–48
Recovering from oversold conditions
A mild bullish divergence is forming (your circled area is correct)
📌 Selling pressure is decreasing, but bullish momentum is not strong yet.
5️⃣ MACD
MACD is still below zero
Forming a higher low
Lines are close to a bullish crossover
📌 This usually happens before the start of a bullish move.
6️⃣ Scenarios
🟢 Bullish Scenario (More Probable)
If:
$200–203 support holds
Price reclaims $215–220
Targets:
$228
$254
$286
Strong breakout → $320–340
(The upward arrow you drew is technically sound.)
🔴 Bearish Scenario (Invalidation)
If:
Daily close below $195–190
Downside targets:
$170–165
Worst case: $120–130 (Fib 1.0)
7️⃣ Quick Summary
Long-term: Bullish
Short-term: Corrective / consolidation
Key level: $203
Bias: Cautiously bullish
⚠️ Disclaimer: This analysis reflects my personal technical view only. I take no responsibility for any buy or sell decisions made based on this analysis.
면책사항
해당 정보와 게시물은 금융, 투자, 트레이딩 또는 기타 유형의 조언이나 권장 사항으로 간주되지 않으며, 트레이딩뷰에서 제공하거나 보증하는 것이 아닙니다. 자세한 내용은 이용 약관을 참조하세요.
면책사항
해당 정보와 게시물은 금융, 투자, 트레이딩 또는 기타 유형의 조언이나 권장 사항으로 간주되지 않으며, 트레이딩뷰에서 제공하거나 보증하는 것이 아닙니다. 자세한 내용은 이용 약관을 참조하세요.