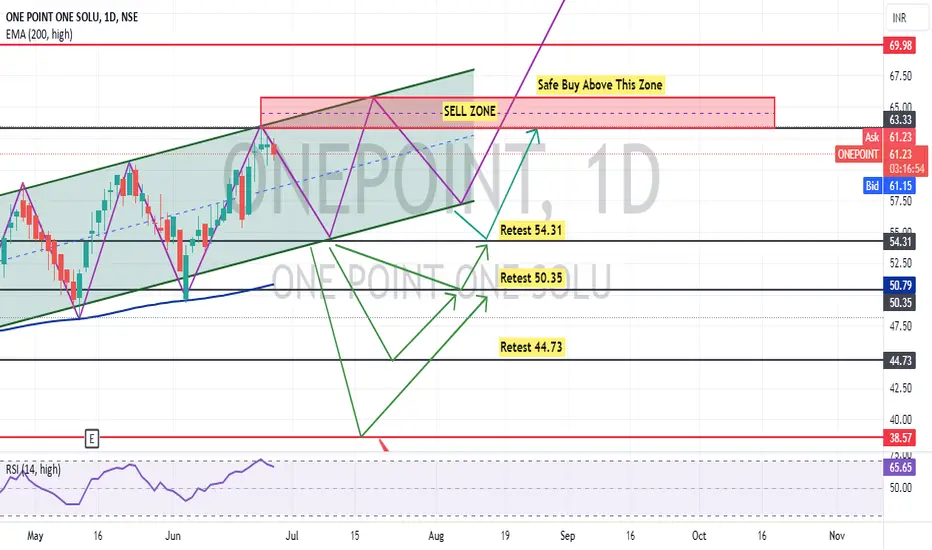
As per previous chart history and current chart pattern, ONEPOINT is making Higher Highs in one day time frame. Soon it will give a breakout either side
You can buy this stock at current market price @61.23 and make average on every dip as shown on the chart or you can wait for a dip to enter in the buy trade
This is my personal opinion and I am not suggesting anyone to buy this stock because I am NOT SEBI registered person
Thanks for your support as always
면책사항
해당 정보와 게시물은 금융, 투자, 트레이딩 또는 기타 유형의 조언이나 권장 사항으로 간주되지 않으며, 트레이딩뷰에서 제공하거나 보증하는 것이 아닙니다. 자세한 내용은 이용 약관을 참조하세요.
면책사항
해당 정보와 게시물은 금융, 투자, 트레이딩 또는 기타 유형의 조언이나 권장 사항으로 간주되지 않으며, 트레이딩뷰에서 제공하거나 보증하는 것이 아닙니다. 자세한 내용은 이용 약관을 참조하세요.