Hello, traders. Nice to meet you.
If you "Follow," you'll always get the latest information quickly.
Have a great day.
-------------------------------------
(ONDOUSDT 1W Chart)
The key is whether the price can find support near 0.832 and rise above the M-Signal indicator on the 1W chart.
The resistance zone is 1.27231-1.61427.
If it falls below 0.832, you should stop trading and wait and see how things go.
-
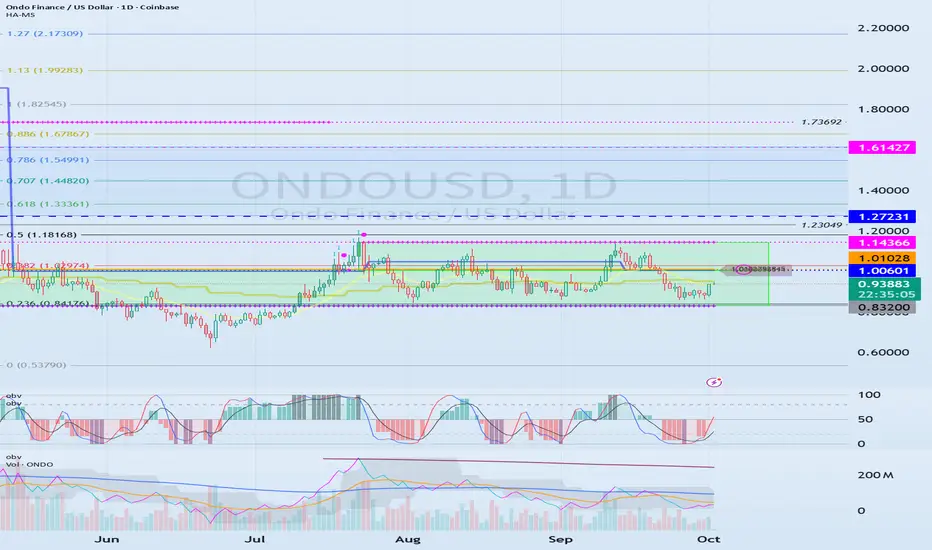
(1D Chart)
The key is whether the price can rise above the 1.00601-1.14366 range, which is the HA-Low and HA-High indicators.
The HA-High ~ DOM (60) range is formed within the 1.00601-1.14366 range, so if this range breaks upward, a step-up trend is likely.
However, the resistance zone on the 1W chart is located at 1.27231-1.61427, so the trend will ultimately be determined by whether support is found within this range.
What we can do is buy in the 0.832-1.14366 range and sell in the 1.27231-1.61427 range.
The reference range for buying is 1.00601-1.01028.
-
Thank you for reading.
We wish you successful trading.
--------------------------------------------------
※ Follow X to check out the posts.
※ X를 팔로우하고 게시물을 확인하세요.
◆ t.me/readCryptoChannel
[HA-MS Indicator]
bit.ly/3YxHgvN
[OBV Indicator]
bit.ly/4dcyny3
※ X를 팔로우하고 게시물을 확인하세요.
◆ t.me/readCryptoChannel
[HA-MS Indicator]
bit.ly/3YxHgvN
[OBV Indicator]
bit.ly/4dcyny3
관련 발행물
면책사항
해당 정보와 게시물은 금융, 투자, 트레이딩 또는 기타 유형의 조언이나 권장 사항으로 간주되지 않으며, 트레이딩뷰에서 제공하거나 보증하는 것이 아닙니다. 자세한 내용은 이용 약관을 참조하세요.