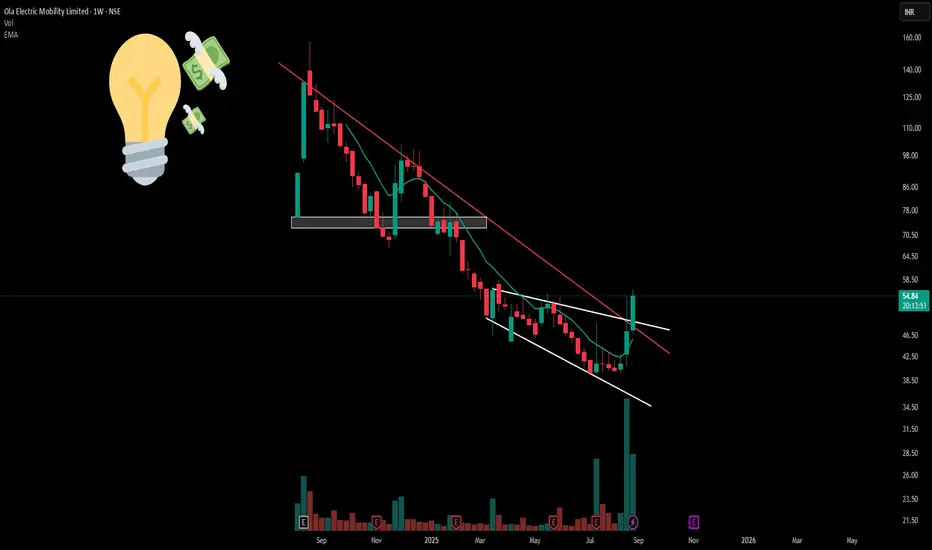
Ola Electric (NSE: OLAELEC) displays a descending channel pattern with the red resistance trendline providing consistent overhead resistance. The stock has operated within this falling channel structure since peak levels, creating defined technical boundaries.
A broadening formation is evident through white trendlines showing expanding volatility ranges.
Exceptional volume expansion compared to historical averages. Combined NSE+BSE volumes substantially exceed normal ranges, indicating institutional participation rather than retail activity.
Disclaimer: Educational content only. Not investment advice. Trading involves substantial risk. Technical patterns don't guarantee outcomes. Consult qualified advisors before investing.
🎯 Master My Self-Made Trading Strategy
📈 Telegram (Learn Today): t.me/hashtaghammer
✅ WhatsApp (Learn Today): wa.me/919455664601
📈 Telegram (Learn Today): t.me/hashtaghammer
✅ WhatsApp (Learn Today): wa.me/919455664601
관련 발행물
면책사항
해당 정보와 게시물은 금융, 투자, 트레이딩 또는 기타 유형의 조언이나 권장 사항으로 간주되지 않으며, 트레이딩뷰에서 제공하거나 보증하는 것이 아닙니다. 자세한 내용은 이용 약관을 참조하세요.