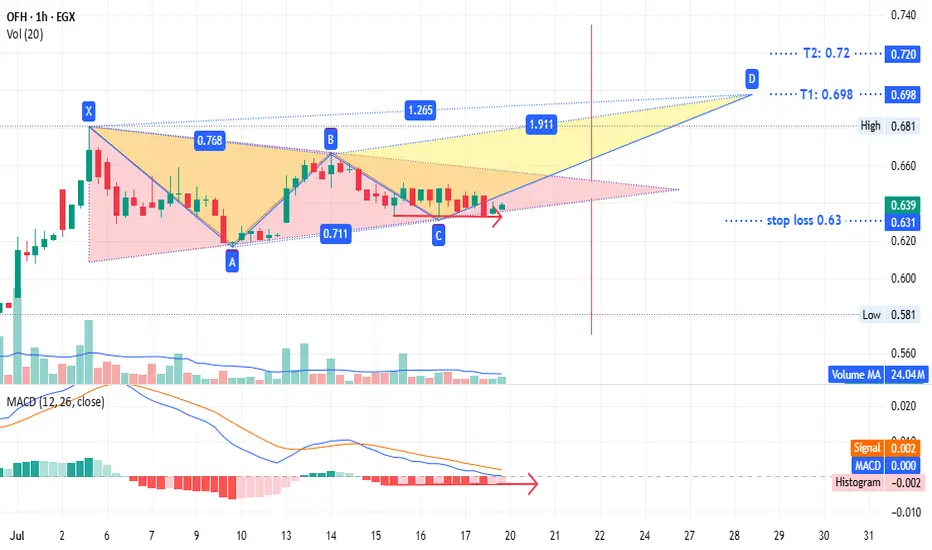
showing a potential triangle pattern with targets at
0.72 if prices close above the upper line or
0.57 if they close below the lower line.
Alternatively, a bearish pattern could target 0.698 to 0.72.
The stop loss is set at 0.63 to 0.624 (the gap from July 13) based on your strategy.
A long position here offers low risk (2% loss vs. ~10% profit potential).
This is not investment advice—only my chart analysis. Consult your account manager before investing. Good luck.
노트
The triangle pattern is confirmed; the target is now 0.72 for a new high. Good luck.액티브 트레이드
amazing all targets achieved
last target at 0.735
if prices closed over 0.745 rebuy what you sell
good luck
거래청산: 타겟 닿음
all targets achieved for all patterns now we have a bearish pattern sell around 0.72
rebuy if prices closed over 0.745
T1: 0.695
T2: 0.665
This is not investment advice—only my chart analysis. Consult your account manager before investing. Good luck.
면책사항
이 정보와 게시물은 TradingView에서 제공하거나 보증하는 금융, 투자, 거래 또는 기타 유형의 조언이나 권고 사항을 의미하거나 구성하지 않습니다. 자세한 내용은 이용 약관을 참고하세요.
면책사항
이 정보와 게시물은 TradingView에서 제공하거나 보증하는 금융, 투자, 거래 또는 기타 유형의 조언이나 권고 사항을 의미하거나 구성하지 않습니다. 자세한 내용은 이용 약관을 참고하세요.