Hi guys,
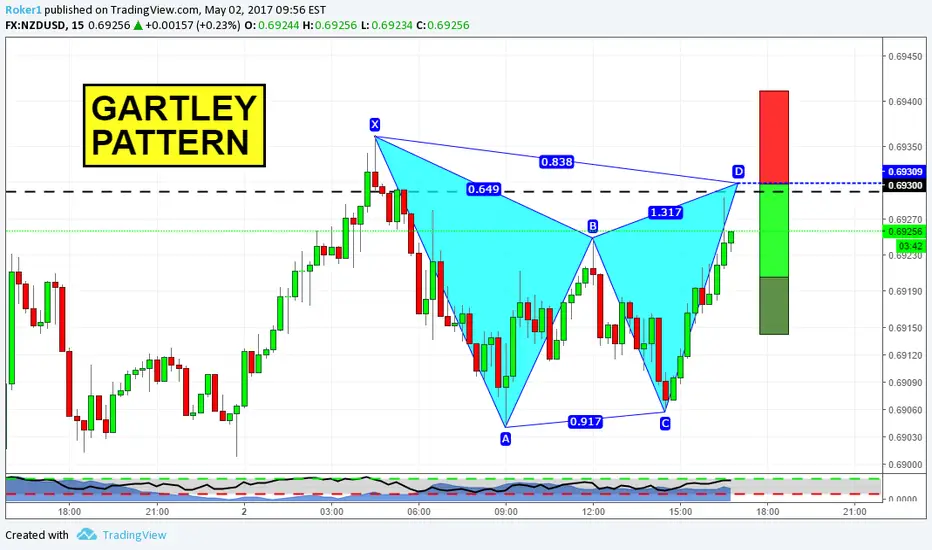
here on the chart you can see 15m timeframe on NZDUSD. This Gartley lines up pretty well with a former structure level that could act as resistance now. Therefore, the likelihood of this trade is increased by that. Stops above X, targets as usual for harmonics.
If you have questions, or if you want to share your view, feel free to comment below.
Otherwise, see you in the next chart!
거래청산: 스탑 닿음
Small loss here면책사항
해당 정보와 게시물은 금융, 투자, 트레이딩 또는 기타 유형의 조언이나 권장 사항으로 간주되지 않으며, 트레이딩뷰에서 제공하거나 보증하는 것이 아닙니다. 자세한 내용은 이용 약관을 참조하세요.
면책사항
해당 정보와 게시물은 금융, 투자, 트레이딩 또는 기타 유형의 조언이나 권장 사항으로 간주되지 않으며, 트레이딩뷰에서 제공하거나 보증하는 것이 아닙니다. 자세한 내용은 이용 약관을 참조하세요.