🔹Technical Analysis of NZDCHF
▪Market Structure Overview
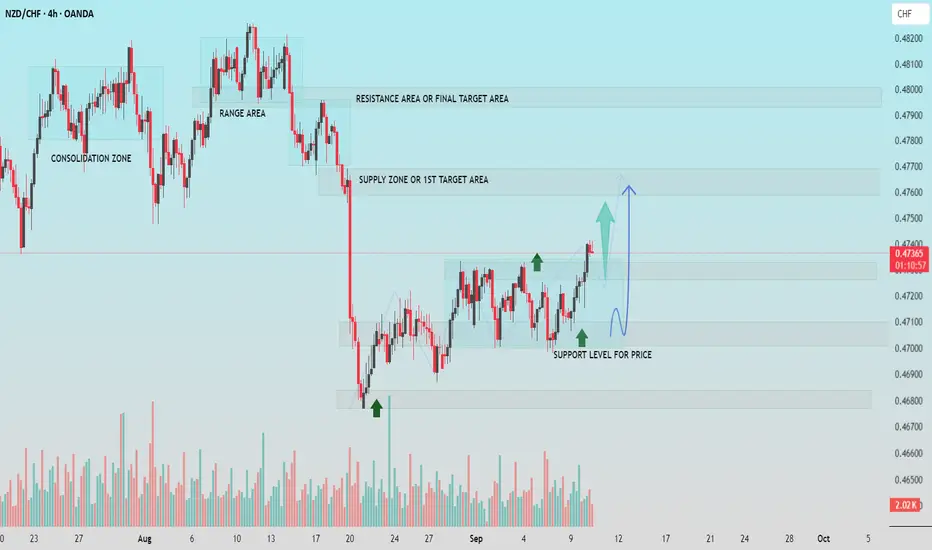
The pair is exhibiting a clear bullish structure after breaking out of a consolidation phase and forming higher highs and higher lows. The current price action suggests continued bullish momentum.
▫Key Zones Identified
▪Support Level:
Around 0.47100, this level has acted as a strong support zone where price bounced multiple times, indicating buying interest.
▪Supply Zone / 1st Target Area:
Near 0.47550, this is the next immediate resistance level, where sellers previously stepped in. Price may face some reaction here.
▪Final Resistance Area:
Around 0.48000, this is the ultimate bullish target. It marks a significant resistance zone from previous price action.
▫Trade Scenario
▪Bullish Continuation:
If price holds above the support level at 0.47100, a breakout toward the 0.47550 supply zone is likely, with potential extension to 0.48000.
▪Pullback Possibility:
A temporary dip back to the support before a continuation move is possible, aligning with the blue arrow projection.
▪Conclusion
The chart structure favors a bullish outlook as long as the price remains above the identified support. Traders may look for buying opportunities on pullbacks with targets at 0.47550 and 0.48000.
Support Me, For More Insightful Analysis.
▪Market Structure Overview
The pair is exhibiting a clear bullish structure after breaking out of a consolidation phase and forming higher highs and higher lows. The current price action suggests continued bullish momentum.
▫Key Zones Identified
▪Support Level:
Around 0.47100, this level has acted as a strong support zone where price bounced multiple times, indicating buying interest.
▪Supply Zone / 1st Target Area:
Near 0.47550, this is the next immediate resistance level, where sellers previously stepped in. Price may face some reaction here.
▪Final Resistance Area:
Around 0.48000, this is the ultimate bullish target. It marks a significant resistance zone from previous price action.
▫Trade Scenario
▪Bullish Continuation:
If price holds above the support level at 0.47100, a breakout toward the 0.47550 supply zone is likely, with potential extension to 0.48000.
▪Pullback Possibility:
A temporary dip back to the support before a continuation move is possible, aligning with the blue arrow projection.
▪Conclusion
The chart structure favors a bullish outlook as long as the price remains above the identified support. Traders may look for buying opportunities on pullbacks with targets at 0.47550 and 0.48000.
Support Me, For More Insightful Analysis.
액티브 트레이드
노트
1st target achieved노트
💸FREE FOREX Signals in Telegram : t.me/FxInsightsHub0
🔹Join Our Telegram Channel, Pure Price Action Based Signals With Chart Analysis.
t.me/FxInsightsHub0
🚀FREE CRYPTO Signals In Telegram: t.me/FxInsightsHub0
🔹Join Our Telegram Channel, Pure Price Action Based Signals With Chart Analysis.
t.me/FxInsightsHub0
🚀FREE CRYPTO Signals In Telegram: t.me/FxInsightsHub0
관련 발행물
면책사항
이 정보와 게시물은 TradingView에서 제공하거나 보증하는 금융, 투자, 거래 또는 기타 유형의 조언이나 권고 사항을 의미하거나 구성하지 않습니다. 자세한 내용은 이용 약관을 참고하세요.