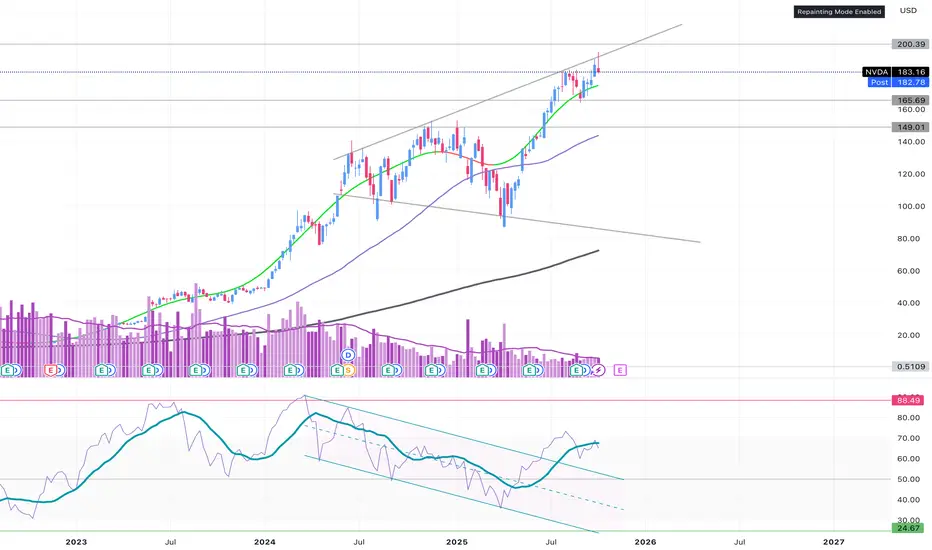
MOMENTUM - daily is in uptrend channel; weekly is ??; monthly looks toppy
VOLUME - some increased volume on the breakout above 183; Overall, volume not significantly changed since the April bottom
PRICE - There is a topping candle on the weekly at the upper trendline of the megaphone; Price reached 195 before reversing back down
What does it all mean?
1. Possible revisit 165
2. Possible revisit 150
3. Possible retouch of 180 and then next move up again
3. Long-term top is in with uncertain future
Let me know what you think….
면책사항
해당 정보와 게시물은 금융, 투자, 트레이딩 또는 기타 유형의 조언이나 권장 사항으로 간주되지 않으며, 트레이딩뷰에서 제공하거나 보증하는 것이 아닙니다. 자세한 내용은 이용 약관을 참조하세요.
면책사항
해당 정보와 게시물은 금융, 투자, 트레이딩 또는 기타 유형의 조언이나 권장 사항으로 간주되지 않으며, 트레이딩뷰에서 제공하거나 보증하는 것이 아닙니다. 자세한 내용은 이용 약관을 참조하세요.