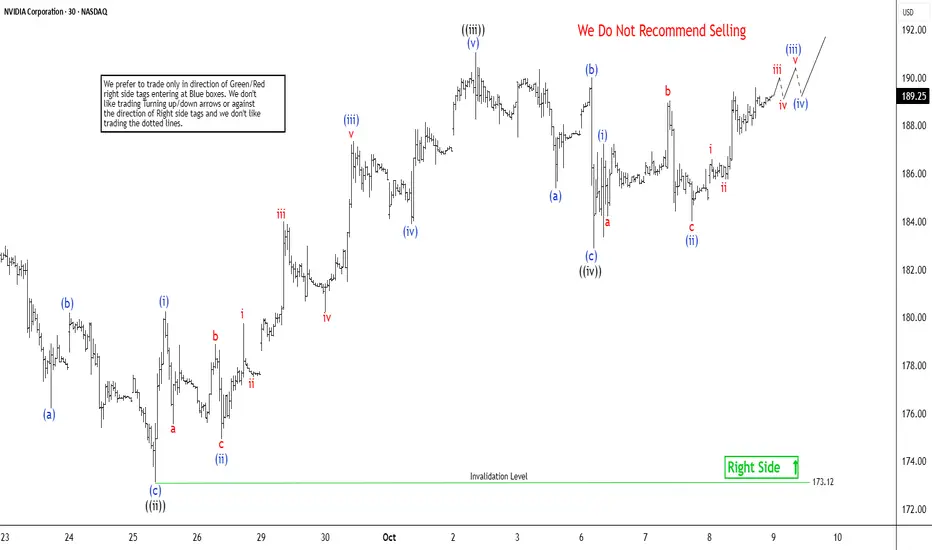
The short-term Elliott Wave analysis for Nvidia (NVDA) indicates that the cycle from the September 18 low is unfolding as a leading diagonal. Starting from that low, wave ((i)) concluded at $184.55, followed by a pullback in wave ((ii)) that ended at $173.12, as depicted in the 30-minute chart. The stock then surged in wave ((iii)), displaying an internal impulse structure. From wave ((ii)), wave (i) peaked at $180.26, with wave (ii) dipping to $174.93. Wave (iii) climbed to $187.35, followed by a wave (iv) pullback to $183.90. The final leg, wave (v), reached $191.05, completing wave ((iii)) in a higher degree.
The subsequent wave ((iv)) pullback formed a zigzag Elliott Wave pattern. From wave ((iii)), wave (a) declined to $185.38, wave (b) rose to $190, and wave (c) dropped to $182.88, finalizing wave ((iv)). The stock has since resumed its ascent in wave ((v)), with wave (i) ending at $187.23 and wave (ii) dips concluding at $184. The stock is poised to climb further, likely completing wave (iii) soon. A wave (iv) pullback should follow to correct the cycle from the October 8, 2025 low before resuming higher. As long as the $173.12 pivot holds, any pullback should find support in a 3, 7, or 11 swing, setting the stage for additional upside.
The subsequent wave ((iv)) pullback formed a zigzag Elliott Wave pattern. From wave ((iii)), wave (a) declined to $185.38, wave (b) rose to $190, and wave (c) dropped to $182.88, finalizing wave ((iv)). The stock has since resumed its ascent in wave ((v)), with wave (i) ending at $187.23 and wave (ii) dips concluding at $184. The stock is poised to climb further, likely completing wave (iii) soon. A wave (iv) pullback should follow to correct the cycle from the October 8, 2025 low before resuming higher. As long as the $173.12 pivot holds, any pullback should find support in a 3, 7, or 11 swing, setting the stage for additional upside.
14 days trial --> elliottwave-forecast.com/plan-trial/ and get Accurate & timely Elliott Wave Forecasts of 78 instruments. Webinars, Chat Room, Stocks/Forex/Indices Signals & more.
면책사항
해당 정보와 게시물은 금융, 투자, 트레이딩 또는 기타 유형의 조언이나 권장 사항으로 간주되지 않으며, 트레이딩뷰에서 제공하거나 보증하는 것이 아닙니다. 자세한 내용은 이용 약관을 참조하세요.
14 days trial --> elliottwave-forecast.com/plan-trial/ and get Accurate & timely Elliott Wave Forecasts of 78 instruments. Webinars, Chat Room, Stocks/Forex/Indices Signals & more.
면책사항
해당 정보와 게시물은 금융, 투자, 트레이딩 또는 기타 유형의 조언이나 권장 사항으로 간주되지 않으며, 트레이딩뷰에서 제공하거나 보증하는 것이 아닙니다. 자세한 내용은 이용 약관을 참조하세요.