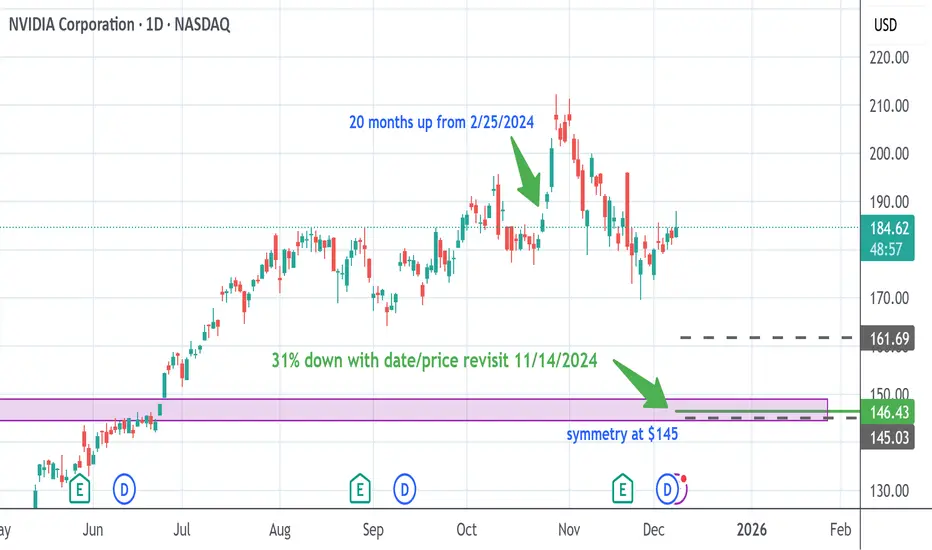
I get my information on where stocks might be headed based on my dowsing- as-in, with a pendulum. A super interesting thing occurred, which is that I did a reading on NVDA back on Feb. 25, 2024, which suggested a future date to be aware of in 20 months from then.
I just put the date in my my phone calendar for Oct. 24th 2025 with a couple alerts so I can pay attention. When I saw NVDA made these highs and pulled right back, I was super intrigued as it was in my date window. It's now head and shouldersy looking, and as such, I did draw a couple symmetry lines (are annotated as gray dashes) for reference.
(Love than my target is right above the second symmetry.)
I have been getting lower levels on NVDA, but I'm getting tired of some of these multiple numbers I get, so I just asked what advice there is and it said to get a date.
When I get a date, it often means a price revisit, or could be a pattern repeats from the past.. In this case, it's suggesting a price revisit to where NVDA traded on 11/14/2024. Then, I asked how many percent down from the ath at $212 & it gives me 31%.
My joy came when I drew the price lines out for the date, and lo and behold they overlay the 31% down price (146.41)!
I attempted to find out when this may hit, and I get Feb. 20th or 26th zone.
Let's boogie!
면책사항
해당 정보와 게시물은 금융, 투자, 트레이딩 또는 기타 유형의 조언이나 권장 사항으로 간주되지 않으며, 트레이딩뷰에서 제공하거나 보증하는 것이 아닙니다. 자세한 내용은 이용 약관을 참조하세요.
면책사항
해당 정보와 게시물은 금융, 투자, 트레이딩 또는 기타 유형의 조언이나 권장 사항으로 간주되지 않으며, 트레이딩뷰에서 제공하거나 보증하는 것이 아닙니다. 자세한 내용은 이용 약관을 참조하세요.