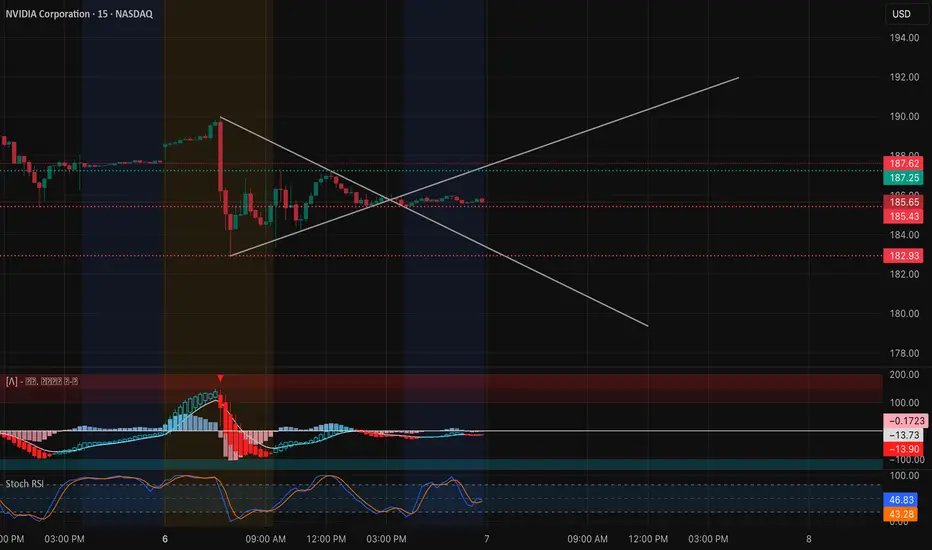
15-Min Chart Analysis (Intraday Trading Setup):
NVDA is forming a symmetrical triangle, compressing between $185–$187.5 after several sessions of choppy consolidation. This coiling pattern reflects equilibrium between buyers and sellers — a setup that typically precedes a strong breakout or breakdown.
Price is currently sitting at $185.65, hugging the triangle’s apex. The MACD is neutral, showing declining momentum but no bearish crossover confirmation yet. Meanwhile, Stoch RSI is resetting mid-range (46.83 / 43.28), suggesting the potential for a new move in either direction once momentum triggers.
Short-term levels to watch:
* Upside breakout zone: $187.25 → $187.62. A break and hold above this level could quickly push NVDA toward $190–$192.50.
* Downside support: $182.93 → $180.50. If price loses $182.93 with volume, it opens room for a retest of the $178 zone where prior liquidity pools exist.
Given the wedge compression, traders should stay patient — the move that follows could be sharp and decisive.
1-Hour GEX Confirmation (Options Sentiment Insight):

GEX levels on the 1-hour chart reinforce the technical setup perfectly:
* Highest positive NETGEX / CALL resistance stands at $192.50, forming a key magnet zone if NVDA breaks out.
* The $185 area aligns with a neutral gamma transition point — a battleground between dealers hedging both directions.
* Strong PUT walls are concentrated around $180–$172.50, creating a solid downside floor.
This gamma structure implies a coiled spring scenario — a decisive break above $187.5 could unleash gamma-driven upside momentum toward $190–$192, while losing $182.9 could accelerate a gamma unwind to $180.
My Thoughts: NVDA’s price action shows tightening volatility, a sign of energy building before expansion. With low IVR (14.8) and IVx (45.9) — volatility is compressed, making directional breakouts ideal for options traders.
I’m watching $187.50 as the key pivot. A breakout above it could trigger a short-term gamma squeeze toward $192.50, while a failure and rejection could lead to a fade toward $182–$180. This setup offers an attractive risk/reward in either direction — ideal for momentum traders.
Options Outlook (Oct 7–11):
* Bullish setup: Consider 187.5C or 190C (Oct 11 expiry) if price reclaims and holds above $187.5 with volume > average.
* Bearish setup: Consider 182.5P if NVDA fails at $187.5 and breaks below $183 with confirmed MACD divergence.
* Volatility note: With IVR at 14.8, option premiums are cheaper than usual — a good opportunity for directional swing entries.
Conclusion: NVDA is consolidating tightly at a critical crossroad. The symmetrical triangle plus neutral gamma landscape signals a breakout is near — watch $187.5 for confirmation. Above it, bulls can push toward $190–$192.5; below $183, bears gain control. Stay alert — the next move could define NVDA’s direction for the week.
Disclaimer: This analysis is for educational purposes only and does not constitute financial advice. Always do your own research and manage your risk before trading.
NVDA is forming a symmetrical triangle, compressing between $185–$187.5 after several sessions of choppy consolidation. This coiling pattern reflects equilibrium between buyers and sellers — a setup that typically precedes a strong breakout or breakdown.
Price is currently sitting at $185.65, hugging the triangle’s apex. The MACD is neutral, showing declining momentum but no bearish crossover confirmation yet. Meanwhile, Stoch RSI is resetting mid-range (46.83 / 43.28), suggesting the potential for a new move in either direction once momentum triggers.
Short-term levels to watch:
* Upside breakout zone: $187.25 → $187.62. A break and hold above this level could quickly push NVDA toward $190–$192.50.
* Downside support: $182.93 → $180.50. If price loses $182.93 with volume, it opens room for a retest of the $178 zone where prior liquidity pools exist.
Given the wedge compression, traders should stay patient — the move that follows could be sharp and decisive.
1-Hour GEX Confirmation (Options Sentiment Insight):
GEX levels on the 1-hour chart reinforce the technical setup perfectly:
* Highest positive NETGEX / CALL resistance stands at $192.50, forming a key magnet zone if NVDA breaks out.
* The $185 area aligns with a neutral gamma transition point — a battleground between dealers hedging both directions.
* Strong PUT walls are concentrated around $180–$172.50, creating a solid downside floor.
This gamma structure implies a coiled spring scenario — a decisive break above $187.5 could unleash gamma-driven upside momentum toward $190–$192, while losing $182.9 could accelerate a gamma unwind to $180.
My Thoughts: NVDA’s price action shows tightening volatility, a sign of energy building before expansion. With low IVR (14.8) and IVx (45.9) — volatility is compressed, making directional breakouts ideal for options traders.
I’m watching $187.50 as the key pivot. A breakout above it could trigger a short-term gamma squeeze toward $192.50, while a failure and rejection could lead to a fade toward $182–$180. This setup offers an attractive risk/reward in either direction — ideal for momentum traders.
Options Outlook (Oct 7–11):
* Bullish setup: Consider 187.5C or 190C (Oct 11 expiry) if price reclaims and holds above $187.5 with volume > average.
* Bearish setup: Consider 182.5P if NVDA fails at $187.5 and breaks below $183 with confirmed MACD divergence.
* Volatility note: With IVR at 14.8, option premiums are cheaper than usual — a good opportunity for directional swing entries.
Conclusion: NVDA is consolidating tightly at a critical crossroad. The symmetrical triangle plus neutral gamma landscape signals a breakout is near — watch $187.5 for confirmation. Above it, bulls can push toward $190–$192.5; below $183, bears gain control. Stay alert — the next move could define NVDA’s direction for the week.
Disclaimer: This analysis is for educational purposes only and does not constitute financial advice. Always do your own research and manage your risk before trading.
면책사항
이 정보와 게시물은 TradingView에서 제공하거나 보증하는 금융, 투자, 거래 또는 기타 유형의 조언이나 권고 사항을 의미하거나 구성하지 않습니다. 자세한 내용은 이용 약관을 참고하세요.
면책사항
이 정보와 게시물은 TradingView에서 제공하거나 보증하는 금융, 투자, 거래 또는 기타 유형의 조언이나 권고 사항을 의미하거나 구성하지 않습니다. 자세한 내용은 이용 약관을 참고하세요.